TradingView is a powerful charting and analysis platform that is widely used by traders,
investors, and analysts in the cryptocurrency market. With its intuitive interface, real-time data,
and vast array of technical indicators, TradingView is a valuable tool for anyone looking to track
and trade cryptocurrencies.
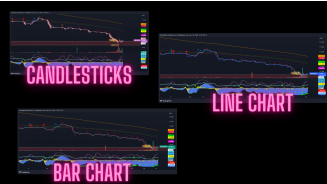
TradingView provides a variety of charts and technical indicators that allow users to analyze market trends, identify potential trade setups, and track the performance of different cryptocurrencies. Some of the different types of charts available on TradingView include candlestick charts, line charts, and bar charts. Each type of chart has its own set of features and can be useful in different contexts.
In addition to charts, TradingView also offers a wide range of technical indicators that can be used to analyze market trends and identify potential trading opportunities. Some of the most commonly used technical indicators on TradingView include moving averages, oscillators, and volume indicators. These indicators can be overlaid on the chart or displayed in a separate window, and can be customized to suit the user’s preferences.
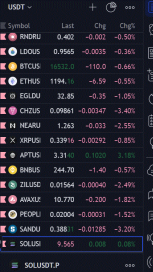
The TradingView user interface is designed to be user-friendly and intuitive, making it easy for users to navigate and find the tools and features they need. The platform includes a customizable watchlist that allows users to keep track of their favorite cryptocurrencies, as well as alerts that can be set up to notify users of important market events or changes in the price of a cryptocurrency.
Overall, TradingView is a powerful and versatile tool that is essential for anyone looking to trade or analyze the cryptocurrency market. With its extensive range of charts and technical indicators, as well as its customizable watchlists and alerts, TradingView is a valuable resource for traders and investors of all levels of experience.