
Crypto & Economic Calendar
The events listed below inform governments, corporations, traders and investors on the health of the economy. I only list events noted by industry as “high volatility expected” in related markets.
- Monday
- 0500 ET: [EUR] Consumer Price Index (CPI)
- Tuesday
- 1000 ET: [USD] ISM Manufacturing Purchasing Managers Index (PMI)
- Wednesday
- 0815 ET: [USD] ADP Non-Farm Employment Change
- 1030 ET: [USD] Crude Oil Inventories
- Thursday
- 0700 ET: [GBP] Interest Rate Decision
- 0830 ET: [USD] Jobless Claims
- 0945 ET: [USD] Services PMI
- Friday
- 0830 ET: [USD] Non-Farm Payrolls
- 0830 ET: [USD] Unemployment Rate
Bitcoin Indecision Continues
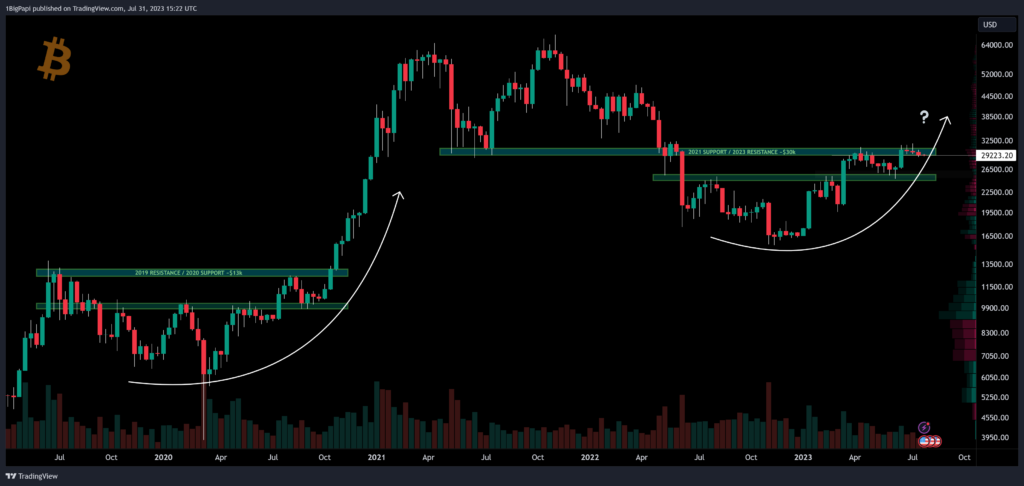
Summary: Bitcoin continues with a measure of uncertainty, ranging tightly between $29k and $30k intraweek, but finally losing $30,000 as the local support into weekly close for the first time in a month. This aligned with our bearish scenario last week of a possible swing low through the upper 20s.
Macroeconomic events remain significant but the narrative is starting to shift from macro to regulatory concerns; and with the US Dollar Index (DXY) on track to lose 101 this quarter, money may begin to return to risk assets, and crypto specifically.
Bitcoin Levels: $30k marked the most important support level in 2021’s bull market. $30k withstood several retests, until the Luna meltdown in mid 2022. Afterwards, Bitcoin didn’t touch $30k again until April 2023, when it began to range between $25,000 and $30,000.
- Immediate resistance: $30,000
- Immediate support: $29,200
- Current value range: $29,000-$30,700 [historically bearish range due to the massive distribution during the Luna meltdown; optimistically flipping to accumulation range now]
- Support levels: $28,900-$29,000; $27,700; $26,300, $25,500
- Resistance levels: $31,300-$32,000; $34,000-$36,500; $37,500; $40,000
Bull Perspective: BlackRock’s request for a Bitcoin Spot ETF and Ripple’s victory in the XRP suit remain the catalyst for increasing bullish sentiment, but macroeconomic factors matter too. While they are marginally improving, a bad month will stifle upward momentum.
- 23.6% fibonacci retracement at $29,400
- 38.2% retracement at $28,800
- 50% at $28,400
- Under $27,000 is unlikely given the current sentiment
- The “bull market support” moving averages (20w & 21w) are between $28k and $28.5k
Bear Perspective: Despite the recent bit of clarity derived from the Ripple win, there is still no clear playbook for crypto in the U.S. The much touted ETF requests are not guaranteed and if they are rejected, may drive a selloff in crypto markets. Additionally, big players like BlackRock isn’t all good news – many have a reputation for manipulating markets.
Example- JP Morgan was recently fined nearly $1 billion dollars for manipulating commodity markets. For good reason we should be cautiously optimistic over the ETF news, and also hope that the SEC and CFTC (US regulators) don’t try to crush traditional crypto players to make room for their friends in traditional financial markets.
Looking at price action, the diagonal support extending from mid 2022 appears to be the trend mean, with price oscillating around it since after the Luna meltdown. As noted last week – bulls couldn’t escape the sell pressure over $31k, another swing low into the upper $20s was inevitable. Now it becomes a test of support, and demand, in this range.
One might suspect that industry players are forcing price into this range so they can accumulate ahead of regulatory approvals.
US Dollar Index (DXY)
SPICY NEWS!
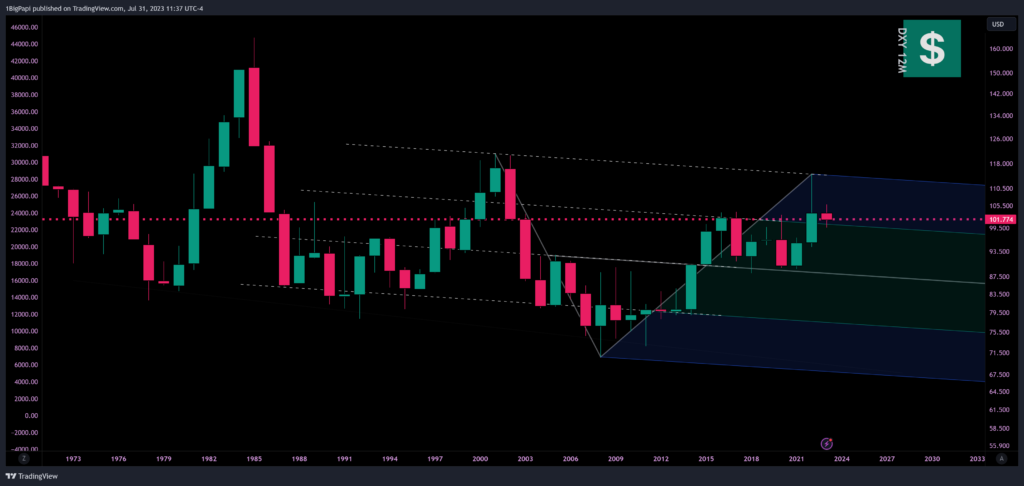
Note: The DXY chart above is set to 12 month candles, to present the general decline of the US Dollar over the past 50 years.
For those who follow this newsletter regularly, you know we’ve been calling a larger selloff on the US Dollar. Specifically we are waiting for the US Dollar Index (DXY) to lose 101 support on the monthly, because historically that leads to prolonged downtrends.
Intramonth, the DXY touched it’s lowest level since April 2022. If you observe the red horizontal level at 101.6, at least 5 times in the past 50 years, losing that led to several years of the US Dollar trending down. If it closes under that level in July, the probability of a prolonged downtrend on the US Dollar increases significantly.
Why do we care about the DXY?
The Dollar Index is a complex financial data point, a lot of external factors impact its value. But in the simplest terms, you can look at the relationship between DXY and risk assets like Bitcoin simply – they usually move inverse to each other. When DXY is up, BTC is down; and the opposite is true.
DXY’s bearish sentiment, coupled with a hawkish outlook for the Euro (a key economic competitor), Bitcoin’s rising sentiment on the back of ETF news and Ripples win, and next year’s Bitcoin halving – things are shaping up for a potentially bullish 2024.
Market Sentiment
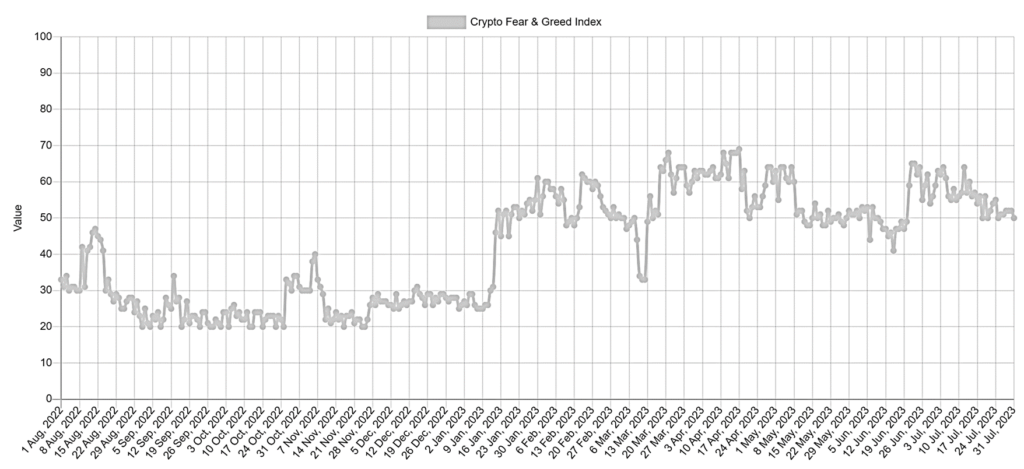
As the narrative shifts from macro concerns to regulatory concerns, we see some indecision. Ranging around 50, this represents a market awaiting news on BlackRock’s ETF, with an approval likely leading to a strong increase in greed across Bitcoin and crypto markets.
Trading Tips
A successful trader should stay engaged on current events and news. Here are a few areas to monitor:
- Economic Indicators: Watch key indicators like employment rates, Gross Domestic Product (GDP), and inflation such as Consumer Price Index (CPI) for insights into the economic health of a country.
- Central Bank Policies: Stay updated with central banks’ interest rate decisions and monetary policies which can impact currency value and market movements. For example, when the US Fed raises rates, it usually leads to a stronger US Dollar.
- Political and Regulatory News: Changes in government, new laws, and international relations can lead to market volatility. Monitor US government regulators such as the SEC or CFTC.
- Geopolitical Risks: Be alert to global events like wars, pandemics, and natural disasters as they can cause market uncertainty and swings. The COVID market crash was a great example of how these events can affect markets, but also present opportunity.
- Market Sentiment: Use tools like the Volatility Index (VIX) to gauge the market’s overall sentiment to help determine the current trend.
If you enjoyed this article and want more hot takes and interesting posts about the economy, web3, crypto, decentralized finance, NFTS and more – you can follow Papi on Twitter/X at https://twitter.com/1MrPapi.
Disclaimer: Nothing found on this website, or any sources linked to this website includes financial advice of any sort. We are not certified financial advisors, use our content at your discretion as entertainment, and as an educational resource. Do your own research.