
Crypto & Economic Calendar
Be advised that events listed below inform corporations, traders and investors on the health of the economy, which leads to volatility in markets. Only experienced traders should trade around these events.
- Monday
- 1230 ET: Tom Crown stream: https://youtube.com/live/xPXJeu3hfH4?feature=share
- 2200 ET: [China] GDP and Industrial Production
- Wednesday
- 0200 ET: [United Kingdom] Consumer Price Index (CPI)
- 0500 ET: [Euro Zone] Consumer Price Index
- TBD: Tom Crown Stream
- Thursday
- 830 ET: Initial Jobless Claims
- 1000 ET: Existing Home Sales
- Friday
- 0430 ET: [United Kingdom] Purchasing Manager’s Index (PMI)
- TBD: Tom Crown Stream
Bitcoin Pullback at Very Key Levels
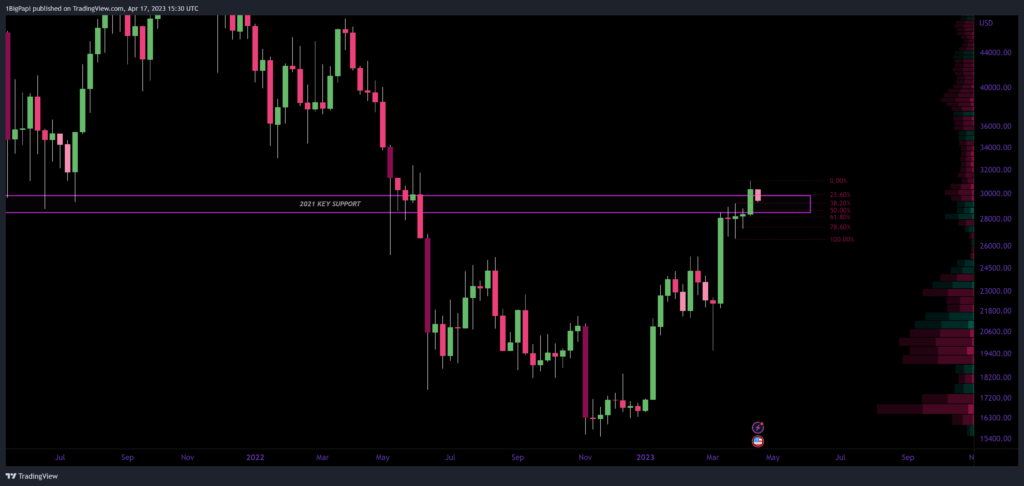
Bitcoin pulled back from last week’s spicy rally over $30,000. The $30k was the high-timeframe bull market support in 2021’s bull market, this is a very important level. This is our first time over $30k since 2022’s Luna / Terra meltdown, that saw one of the top cryptocurrencies go to zero.
Predictions are mixed, with some calling for retracements deeper into the $20k-$28k range; others calling for upside continuation after a smaller retracement in the upper $20s. The uptrend is likely intact if price closes the weekly over $28,000. General sentiment appears to favor bulls currently.
The author suspects upside continuation after a small retracement this week, but some data, like momentum and sentiment, suggests the uptrend may be approaching a local peak, and a larger correction is coming. Keep in mind that while data suggests overbought conditions, it can remain that way for weeks or even months.
If you haven’t experience large downside moves before, here are some tips:
- If you are stacking spot or using a Dollar Cost Average (DCA) strategy, reduce your buying interval until we see momentum like RSI or TSI reset on the daily or weekly, or for the Fear and Greed Index to drop.
- If you are swinging spot, monitor your stoploss and profit targets; be more judicious about moving them with price to avoid getting caught by sudden pivots in the market and maximize profit.
- If you are day-trading or margin trading, you shouldn’t be too impacted. Just be careful not to marry a directional bias, like looking for longs when the market suggests it’s reversing. Its easier to trade the prevailing trend than against it.
- If you are staking and have a large amount of rewards to claim, consider moving a portion into BTC, ETH or stablecoins over time. This will hedge against large downside moves in the future as BTC and ETH tend to be less impacted.
Bitcoin Dominance Retraced
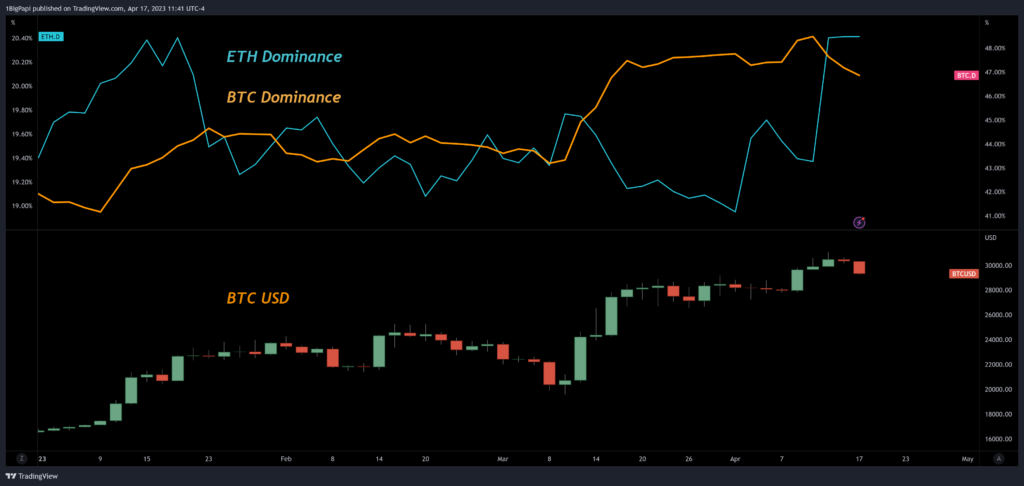
Before Bitcoin’s price peaked last week, it’s market dominance was dropping. This indicates a capital rotation into altcoin markets and stables. While Bitcoin’s dominance dropped over 4% in the past week, Ethereum’s remained stable, also suggesting that it gathered some of Bitcoin’s lost market share.
This can lead to a temporary environment where altcoins make gains, and you may see some low market cap (ie. shitcoins) popping off. Be careful not to FOMO or chase pumps on relatively unknown or new projects.
Success in 2023 means preserving as much of your capital as possible, and in quality projects. There will also be some random projects that pump, even in the worst conditions; and often they are manipulated or illiquid and you risk not being able to withdrawal any gains.
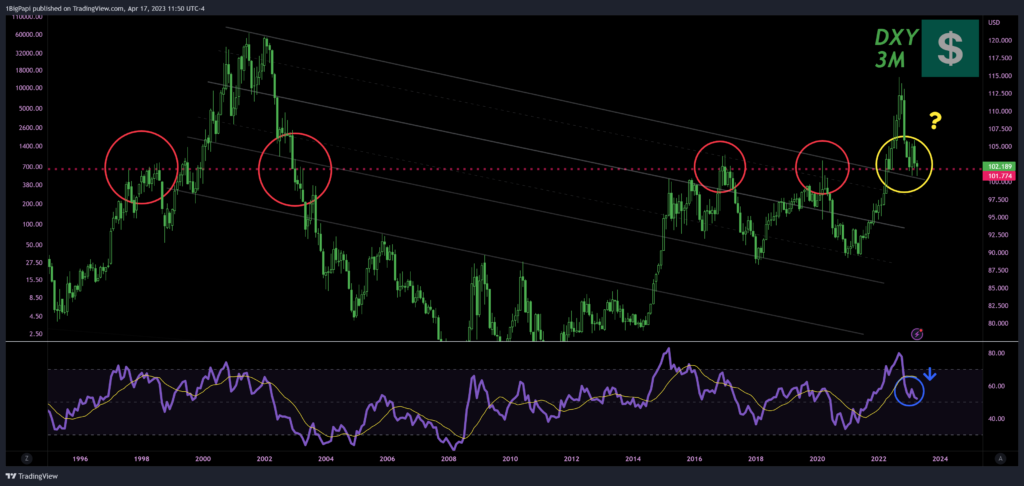
US Dollar Index (DXY)
As mentioned last week, the DXY and Crypto have generally inverse trends. This is one of the simplest and meaningful data points for investors and traders to monitor.
- When the DXY drops, this typically sends crypto higher, due to an increased appetite for risk assets like crypto.
- The opposite is true if the DXY rises, as it indicates an appetite for safe havens like the US Dollar, and retreat from risk assets like cryptocurrency.
The DXY continues flirting with a historically bearish level, around 101. In every instance over the past forty years where the Dollar closed below 101, it trended lower for at least a year. DXY wicked below that level twice recently, and appears poised to go lower in the coming weeks.
Of course there are no sure bets in trading or investing, which is why we monitor economic data for indicators of where the Dollar will go next.
Market Sentiment
Current market sentiment is greedy and setting new highs for 2023 and the past year. After bottoming in Q2 2022, following the Luna Terra meltdown, the market sentiment steadily improved. Even after the FTX collapse, sentiment quickly recovered.
This is a positive sign as it show’s organic growth and healthy recovery from the depths of the bear market.
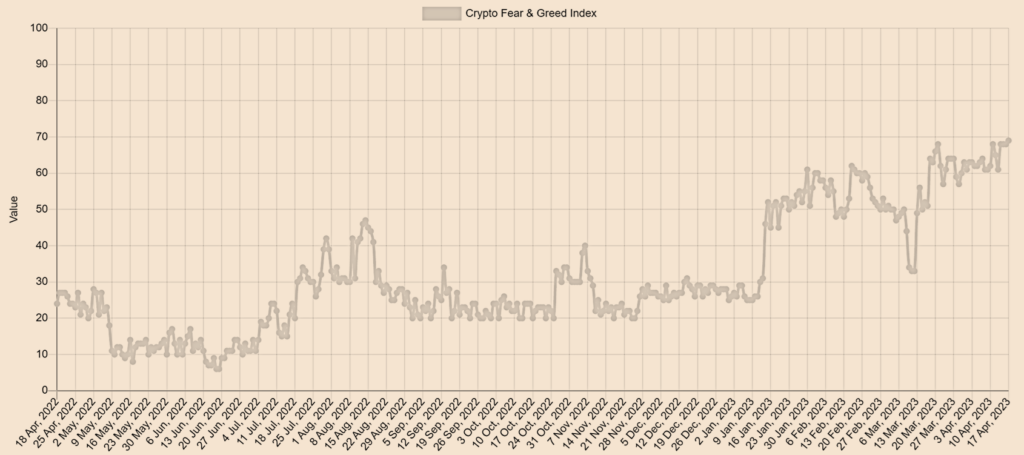
The Fear and Greed Index is a useful reference, in general greed levels over 70 for prolonged periods lead to steep corrections. This isn’t always the case, and the market can remain over 70 for a long period, so its an imperfect data point by itself, but helpful when combined with other information. The current F&G rating is 69.
If you enjoyed this article and want more hot takes and interesting posts about the economy, web3, crypto, decentralized finance, NFTS and more – you can follow Papi on Twitter at https://twitter.com/1MrPapi.
Disclaimer: Nothing found on this website, or any sources linked to this website includes financial advice of any sort. We are not certified financial advisors, use our content at your discretion as entertainment, and as an educational resource. Do your own research.