
Bitcoin – Welcome to the Post-ETF World
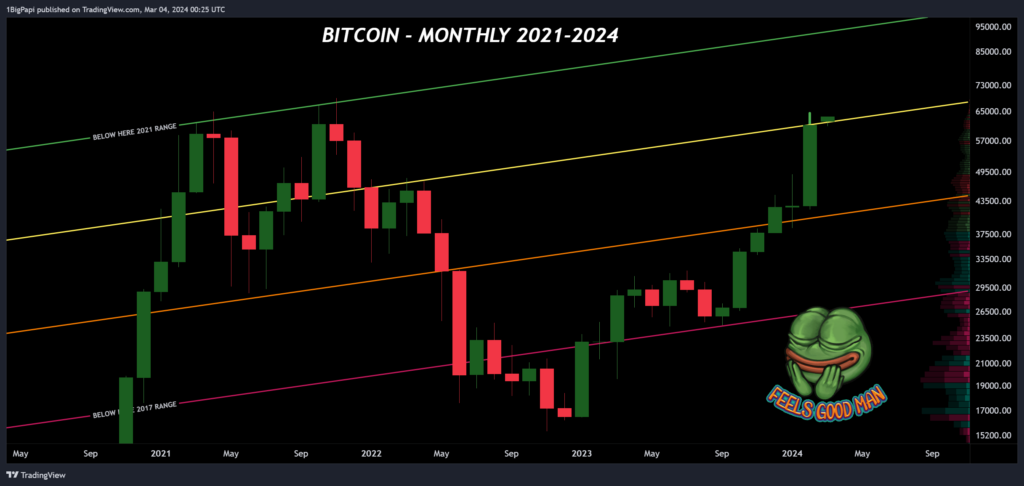
Summary: Our premise remains simple: price over $35k is an uptrend, over $44k is bullish, and under previous highs, keep stacking.
But if you are still buying spot, keep in mind that the risk/reward of buying skews less favorably once Bitcoin enters price exploration above $70,000 and higher. Low timeframe trades remain viable, especially with altcoins, but you need to run tigher stoploss or invalidations for your trades, otherwise you risk of buying a major top.
The bullish narrative is focused on the Bitcoin halving and the success of the Bitcoin ETFs. The bearish narrative suggests that the macroeconomic conditions are unhealthy, and some politicians taking an anti-crypto position. Bullish sentiment is currently prevailing.
- Immediate resistance: ~$65,300, $69,420
- Immediate support: ~$61,759 (diagonal support extending from 2021)
- Current value range: $60,000 and higher
- Bull Market Support: 21w EMA is $45,243, 20w SMA is $44,230
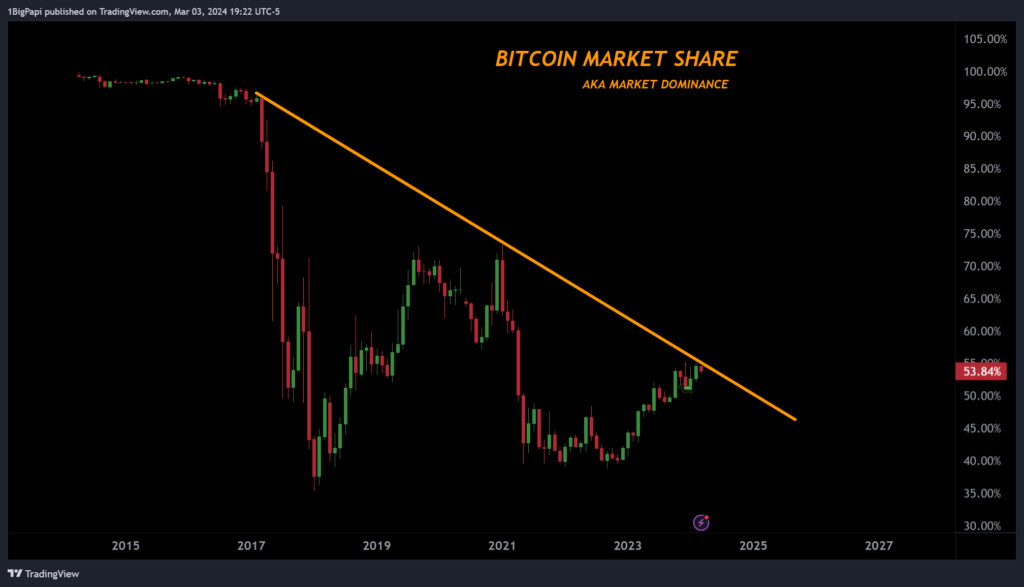
Bitcoin Dominance
Bitcoin dominance is another way of saying “Bitcoin market share,” or how much of the total crypto market is Bitcoin. Over time Bitcoin’s market share is trending down as altcoins and stablecoins grow in popularity. But on lower timeframes, you can also Bitcoin Dominance to guage when altcoin markets may rally. This is also described as an “alt season.”
For example, over the past week many of you probably saw news about memecoins and other altcoins rallying. Such rallies often follow a local or major top on Bitcoin dominance.
Well as you see on the chart below, Bitcoin is currently running into major resistance, extending from 2016. If Bitcoin’s Dominance rejects here, it might reflect a coming opportunity for altcoin markets to rally.
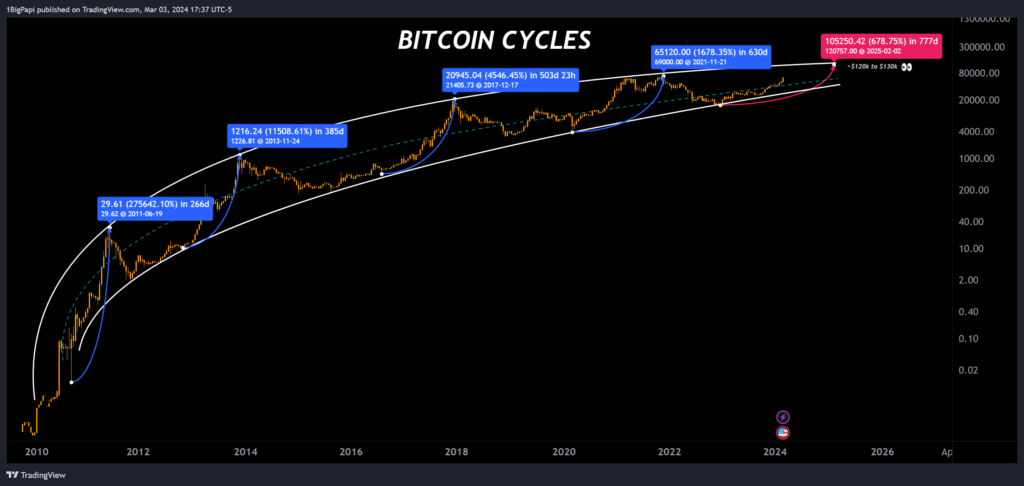
Long Term Cycle Forecast
When discussing cycle tops, you’ll get a range of answers. From this writer’s perspective, Q1 2025 between $100,000 and $130,000 are the most likely for cycle top. This aligns with historical trends.
But this also warrants some caution- this cycle is a little different due to institutional buyers and boomers entering the market. For that reason, be careful relying too much on earlier trends, and look for confluence with other data points.
On-Chain Data
Given that we are approaching price exploration in a new cycle, traders should begin evaluating different data that might suggest a minor or major top. Never take a singular indicator as gospel, and look for confluence across multiple data points. Below are a few popular ones.
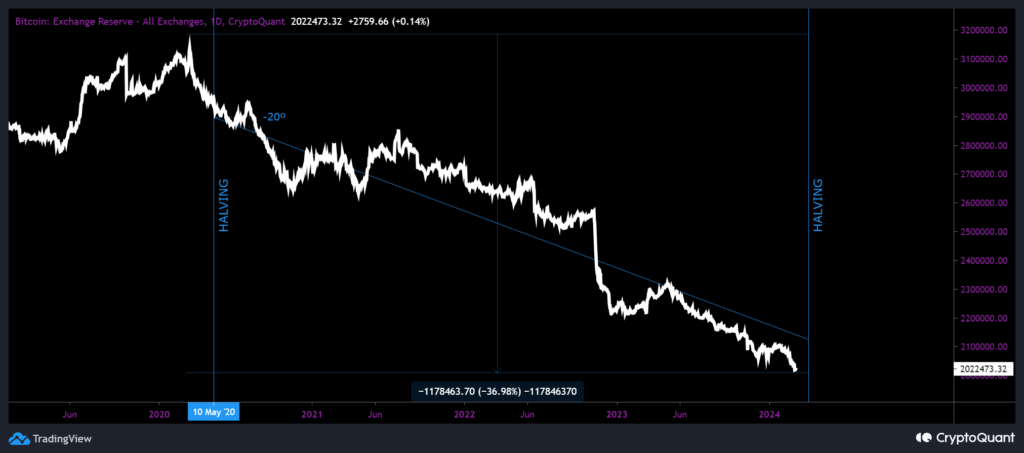
Supply of Bitcoin on Exchanges
One of my favorites is Bitcoin supply trends. On-chain analysts monitor the supply of Bitcoin on exchanges. Their assumption is that rising supply on exchanges is bearish, because it’s likely there to be sold. But this also brings us to an interesting point-
More Bitcoin is being bought and HODL’d than is being mined, and this has been the prevailing trend since 2020. As we know with commodities, scarcity boosts percieved value. And with a 37% drain on total supply since 2020, we are trending towards scarcity faster than ever. Its possible within the decade that we could enter a supply crunch, where Bitcoin and satoshis are diffcult to purchase.
On lower timeframes, towards the end of a cycle, you typically see heavy inflows of Bitcoin as whales average out of positions. The wildcard this cycle is how much ETF and increased demand from the general public will offset this typical end-of-cycle selloff.
All of this to say – while you may be interested in the short to mid-term outlook for Bitcoin and crypto markets, its also a good time to consider your longer term position over the next decade, especially for leading cryptocurrencies like Bitcoin and Ethereum.
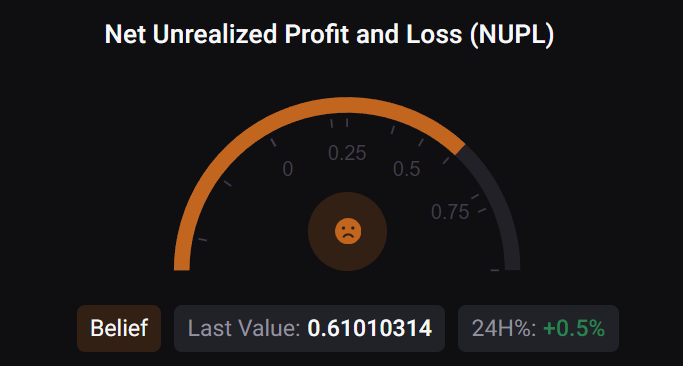
Net Unrealized Profit and Loss (NUPL)
NUPL ndicates the total amount of profit/loss in all Bitcoins, represented as a ratio. You can see why that makes for a handy data point, because as more of the market is in-profit, the risk of a retracement rises.
Currently NUPL is trending in the “belief” range, where traders are holding and expect more upside. NUPL indicates a potential minor or major top whe it rises over 0.75. This is considered moderately risky as it shows NUPL trending towards with the greedy range, where instability grows, and selloffs are probable.
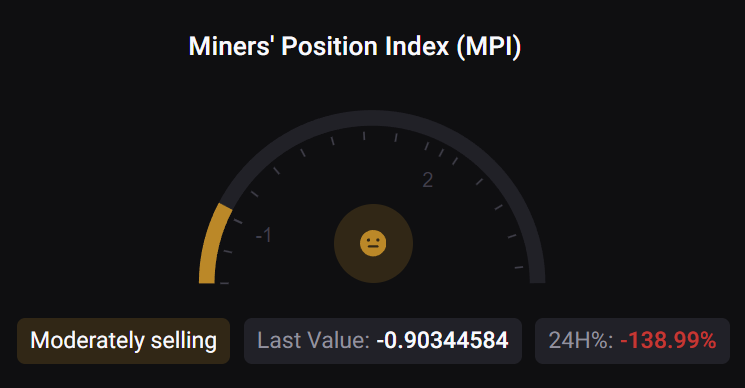
Miner Position Index (MPI)
Miners are among the smartest traders in crypto. For obvious reasons they need to optimize their Bitcoin sells to fund operations. Miners generally sell as little as possible during bearish market conditions, and sell heavily into the early to middle bull market.
MPI is the ratio of miner selling against the yearly average. If its rising strongly against historical data, it suggests miners are worried about a top approaching and judge this as a reasonable time to exit the market. They do not try to land the top of the market, so they often sell in advance, and the actual top might not be for another month or more.
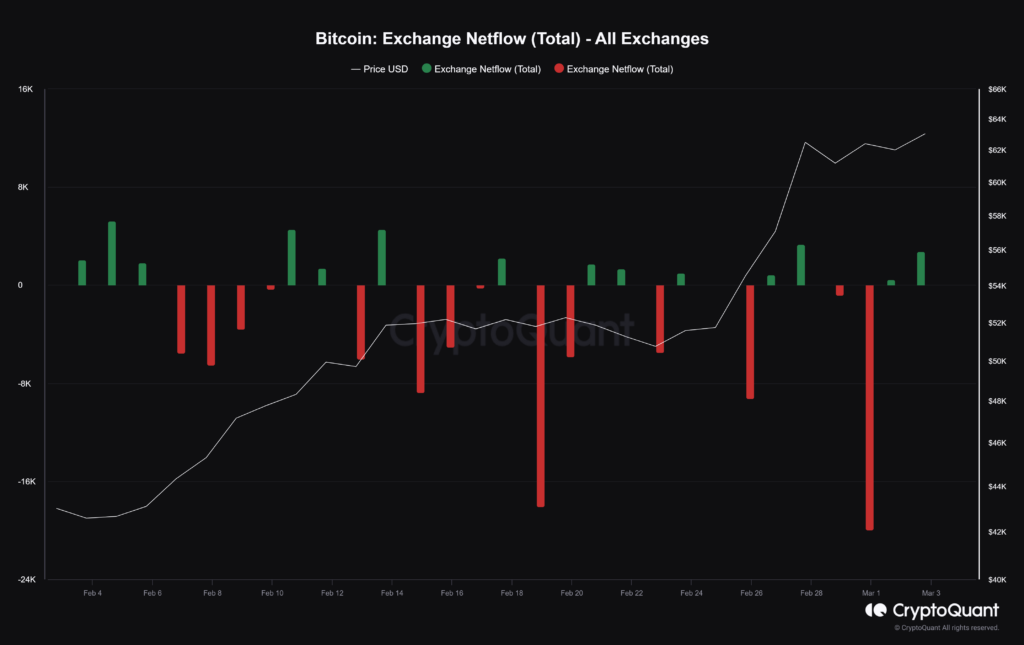
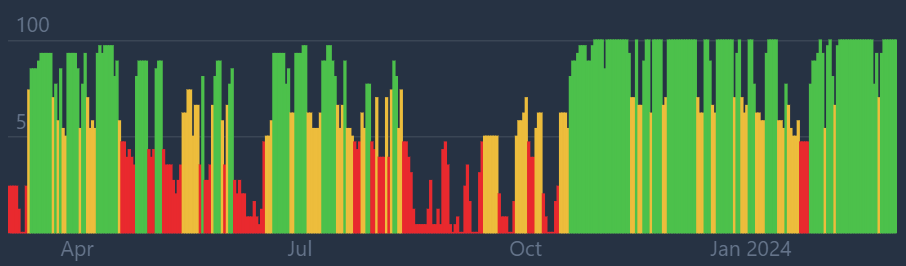
Bitcoin Netflow (All Exchanges)
Another fun data point is netflow. This shows the net result of a day’s inflows (moving Bitcoin to an exchange) and outflows (moving Bitcoin off an exchange).
The implication is that Bitcoin moved off exchanges is unlikely to sell. And as we approach tops, the netflows skew towards increasingly heavier inflows (moving to exchanges to sell).
Green on the chart below represents the inflow of Bitcoin to exchanges. Red is outflows, likely from someone buying Bitcoin and moving it to cold storage. Over the past month, you can clearly see that we are in an outflow trend, implying bullish sentiment is prevailing and buyers plentiful.
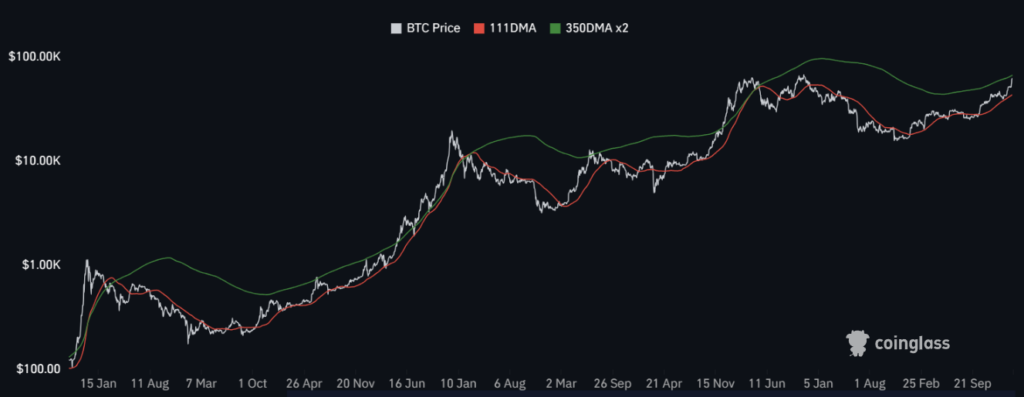
Pi Cycle Indicator
The Pi Cycle indicator is something many traders joke about, but there is no doubting it’s effectiveness.
It uses the crossing of two key moving averages (MA) to predict cycle tops: 111 DMA and 350DMA x2. It accurately called earlier cycle tops within a few days. The top signal is when the 111 DMA crosses above the 350 DMA x2.
Whether you believe these two MAs can predict cycle tops, its worth keeping an eye on it. As you can see, we still have time before the MAs converge. Eyeballing the current trend angles, we can estimate end of 2024 to early 2025 for them to cross.
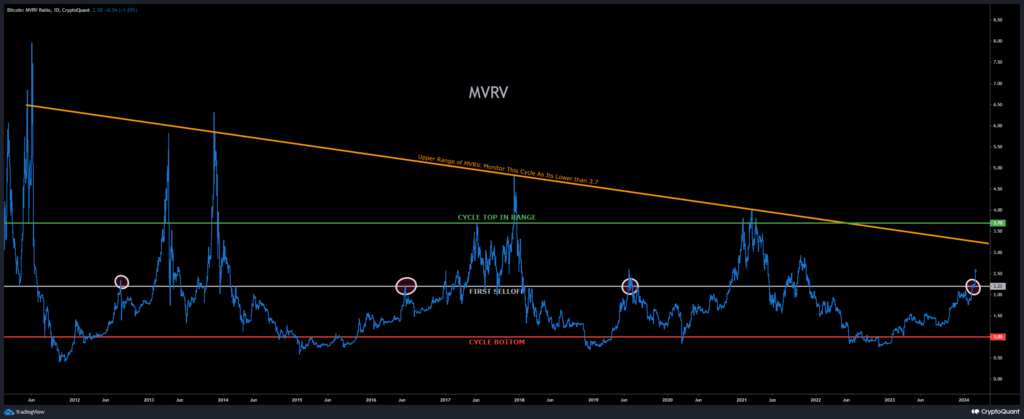
Market Cap to its Realized Cap (MVRV)
MVRV is used to understand when the exchange traded price is below “fair value” by looking at the ratio between market cap and realized cap (approximates the value paid for all coins in existence).
This gives an idea of whether the market is fairly priced and can be used to identify potential tops and bottoms in the market. As with any indicator, don’t use it in isolation; look for confluence with other data.
A new component this cycle is the orange line, the top of the MVRV range, which reflects an increasingly smaller ratio over time. For the first time this cycle, it is lower than the generally acccepted upper range of 3.7 for cycle tops, so traders should monitor both.
US Dollar Index (DXY)
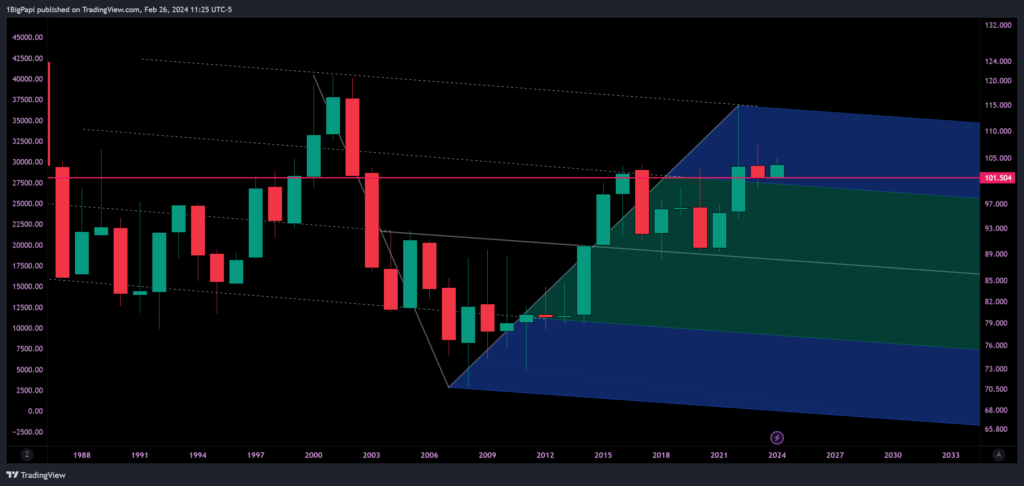
The US Dollar Index (DXY) is an index that measures the strength of the US Dollar. We’ve discussed the inverse relationship between the the DXY and speculative markets like crypto and equities. In general, when the DXY is up, crypto is down. The opposite is also true.
Of particular importance, the ~101 level, arguably the most significant for the DXY. Almost every time in the past 50 years, when DXY rejected from, or closed under the 101 range, it led to a prolonged period of weakening dollar. And if the fed drops rates in 2024, thats a strong signal that the DXY will continue to drop.
Market Sentiment
Economic events, political discourse, or general price action are all events that can impact sentiment. The market is currently overwhelmingly bullish, and has been since October 2023.
This is a reflection of increasingly positive sentiment around cryptocurrencies. Various factors can affect sentiment, which in turn can lead to a selloff.
Note: Remember Bitcoin, Ethereum, cryptocurrency is apolitical; its designed by and for the people. Governments, banks, funds, they are tourists here.
Crypto & Economic Calendar
Disclaimer: Nothing found on this website, or any sources linked to this website includes financial advice of any sort. We are not certified financial advisors, use our content at your discretion as entertainment, and as an educational resource. Do your own research.
The events below inform governments, corporations, traders and investors on the health of the economy. I only list events noted as “high volatility expected” in related markets.
| Time (ET) | Cur. | Event | Forecast | Previous |
| Tuesday, March 5, 2024 | ||||
| 9:45 | USD | S&P Global Services PMI (Feb) | 51.3 | 52.5 |
| 10:00 | USD | ISM Non-Manufacturing PMI (Feb) | 52.9 | 53.4 |
| 10:00 | USD | ISM Non-Manufacturing Prices (Feb) | 64 | |
| Wednesday, March 6, 2024 | ||||
| 5:00 | GBP | Spring Forecast Statement | ||
| 8:15 | USD | ADP Nonfarm Employment Change (Feb) | 145K | 107K |
| 9:45 | CAD | BoC Interest Rate Decision | 0.05 | 0.05 |
| 10:00 | USD | Fed Chair Powell Testifies | ||
| 10:00 | USD | JOLTs Job Openings (Jan) | 8.895M | 9.026M |
| 10:30 | USD | Crude Oil Inventories | 4.199M | |
| Thursday, March 7, 2024 | ||||
| 8:15 | EUR | Deposit Facility Rate (Mar) | 0.04 | 0.04 |
| 8:15 | EUR | ECB Interest Rate Decision (Mar) | 0.045 | 0.045 |
| 8:30 | USD | Initial Jobless Claims | 212K | 215K |
| 8:45 | EUR | ECB Press Conference | ||
| 10:00 | USD | Fed Chair Powell Testifies | ||
| Friday, March 8, 2024 | ||||
| All Day | Russia – Women’s Day | |||
| All Day | India – Mahashivratri | |||
| 8:30 | USD | Average Hourly Earnings (MoM) (Feb) | 0.002 | 0.006 |
| 8:30 | USD | Nonfarm Payrolls (Feb) | 190K | 353K |
| 8:30 | USD | Unemployment Rate (Feb) | 0.037 | 0.037 |
——————————————————————————-
If you enjoyed this article and want more hot takes and interesting posts about the economy, web3, crypto, decentralized finance, NFTS and more – follow Papi on Twitter/X at https://twitter.com/1MrPapi.