
Bitcoin – Consolidation Under All-Time-Highs
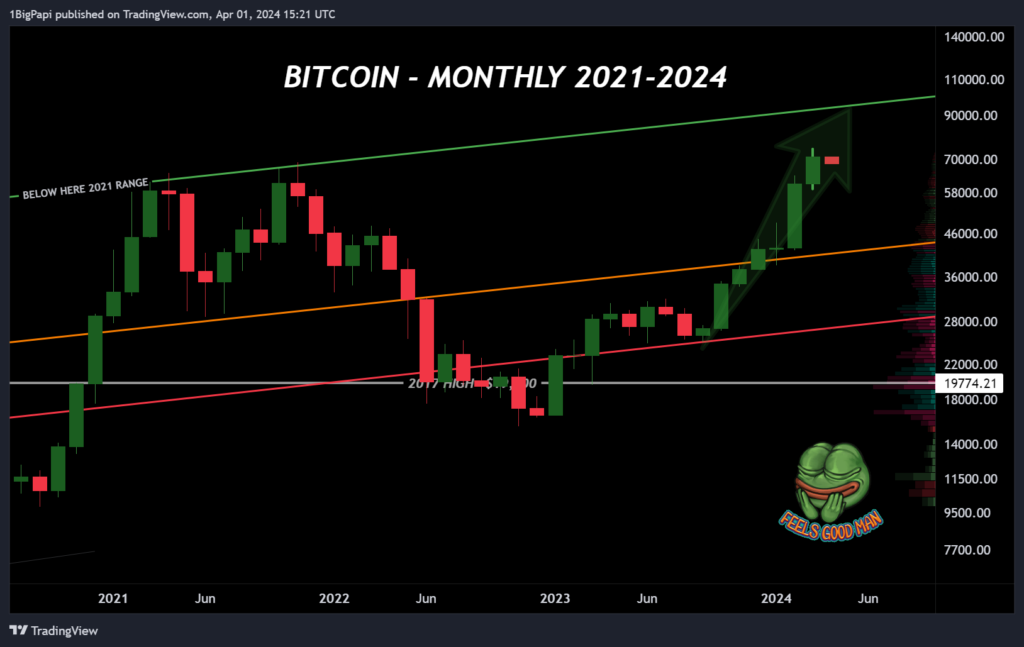
Summary: We closed a 7th monthly green candle! The last time that happened was 12 years ago! This feels like a significant indicator of where the market is going. In the meantime, we continue to consolidate with under previous highs, and the state of the bull market is largely healthy, with a bias to the upside.
So why is the market indecisive? According to most data and indicators, this is a consolidation period. Consolidations occur along key levels, as bears and bulls jockey for position, weak hands take profit, and stronger hands accumulate. Consolidations usually break in the direction of the prevailing trend; in the case of a bull market, that would be to the upside.
Bull Case: halving is in 3 weeks; ETF interest remains steady; semantics around the overall crypto market and Bitcoin are vastly improved from past cycles; and nearly all on-chain and sentiment data indicates a bullish market, but not excessively greedy or overbought yet; Coinbase app isn’t near the top of app ranking at all.
Bear Case: the US Fed may not taper rates as early as markets anticipate; the US election could introduce divisive political and regulatory dialogue around cryptocurrency; a small number of on-chain indicators show the market is very near or into the range where cycle tops occur; memecoins are rallying in an usual display of early market mania; the US Dollar Index is benefiting from weakness in competing currencies, leading the DXY to rise.
What you do from here is based on your risk appetite. Writers and analysts can speculate on the future, but no one knows for sure. Here are your options:
- If you are still buying spot (as I am), use this time to rotate out weak performers, and double-down on strong performers. Don’t ape and lose it all on memecoin rugs. Be aware of tax implications as you do this and set aside some stables or cash for that.
- If you are a LOW RISK spot holder, you should already be exiting positions. Sell and don’t look back, or FOMO might pull you back in. Cycles won’t be as pronounced as in the past, so your future buy-in during bear might be as high as $40k-50k.
- If you are a day trader, continue to respect the overall high-timeframe bias to the upside. There will be corrections your risk of invalidation or liquidation are greater in short positions.
Promising Narratives I’ve been monitoring into this part of the cycle are listed below. If you are looking to rotate into something new, they may offer respectable risk/reward, but do your own research:
- Utility expansion on Bitcoin, like ordinals, Stacks, Runestone
- Solana’s maturing DeFi ecosystem and memecoins
- Ethereum L2s and L3s, especially those build around BASE
- OG projects like DOGE or LTC that might see institutional interest
- Emerging L1s like SEI that have VC investors & interest
- Memecoins with utility, for example if Elon adopts DOGE for Twitter
- GameFi or NFTs related to gaming
- Web3 and crypto digital art. Cryptopunks, XCOPY, Beeple, and many others.
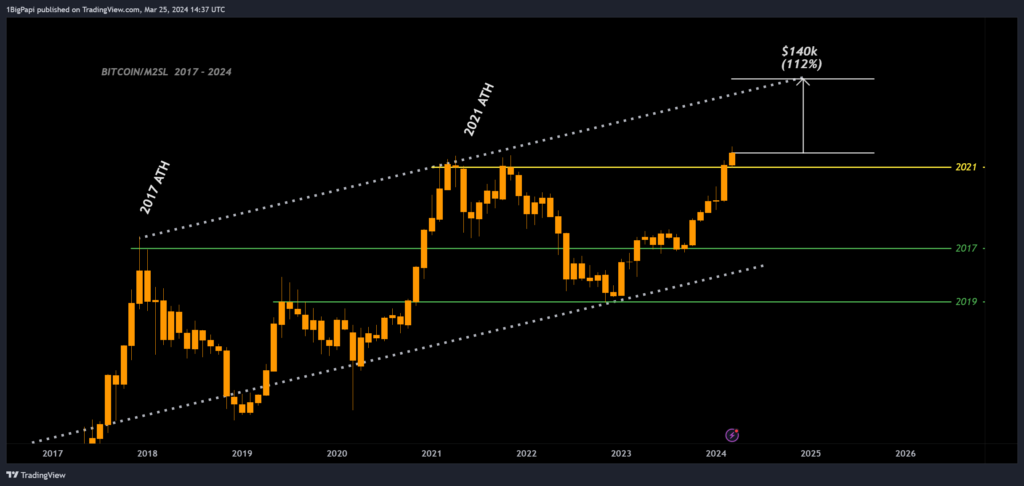
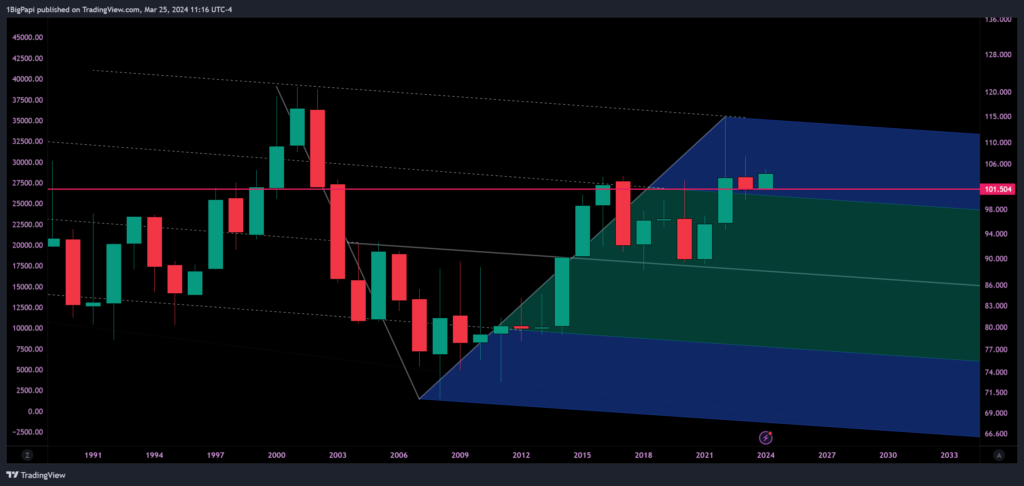
Long Term Cycle Forecasts
The market is rarely this simple, but one possibility is for the top to arive along the same diagonal range we saw in 2017 and 2021, which would land around $140k.
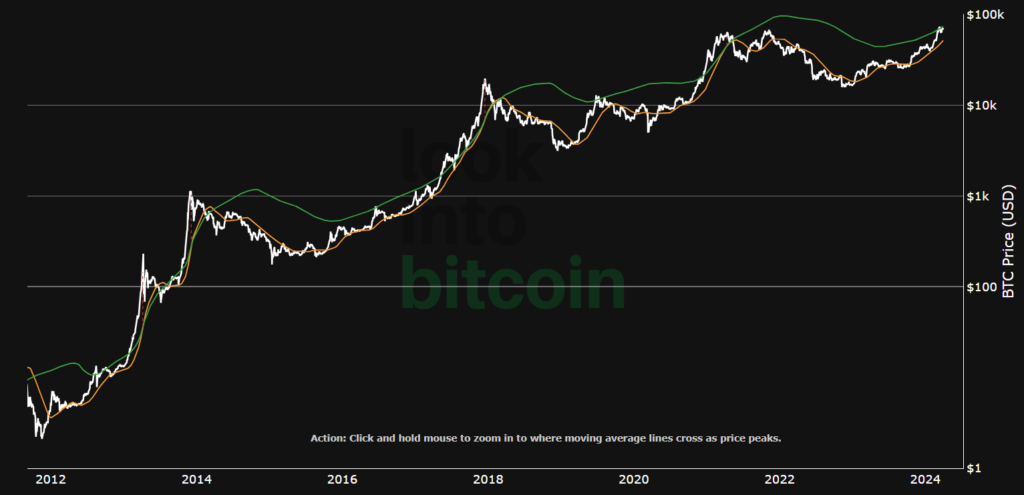
Below is the totality of Bitcoin’s logarithmic growth, another great way to display data that spans many orders of magnitude. This shows Bitcoin reaching the lower $100k range by early 2025. When considering the current cycle’s growth trajectory, that could arrive earlier, and go higher.
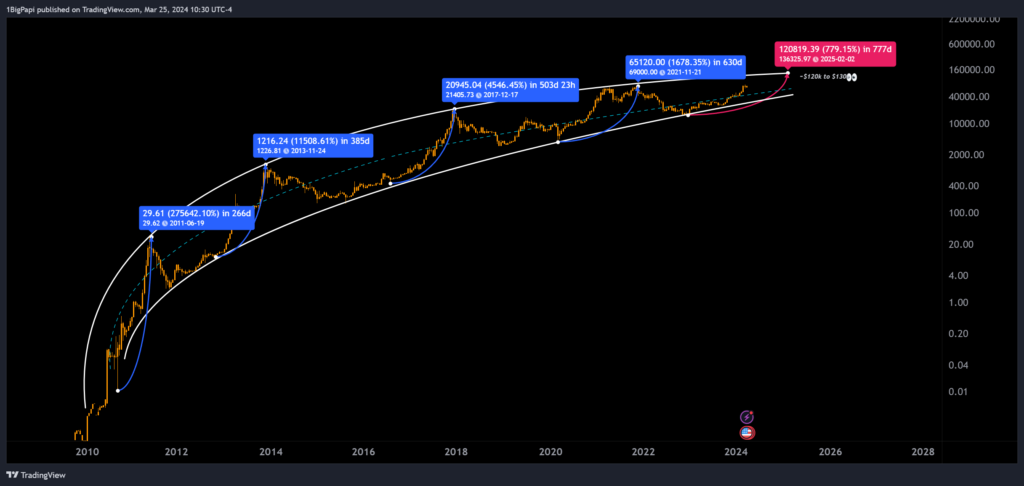
This cycle is different, due to institutional buyers. So its difficult to rely on earlier trends, so we should look for confluence across several data points when forecasting this cycle. Thats why we review key on-chain and sentiment data weekly [below].
Market Health – Is Cycle Top Near? Read On..
Traders should look for agreement or confluence among several data points when it comes to estimating a cycle top/range. Never take a singular indicator as gospel. A glossary of each item is at the end of the article. Lets review the market-
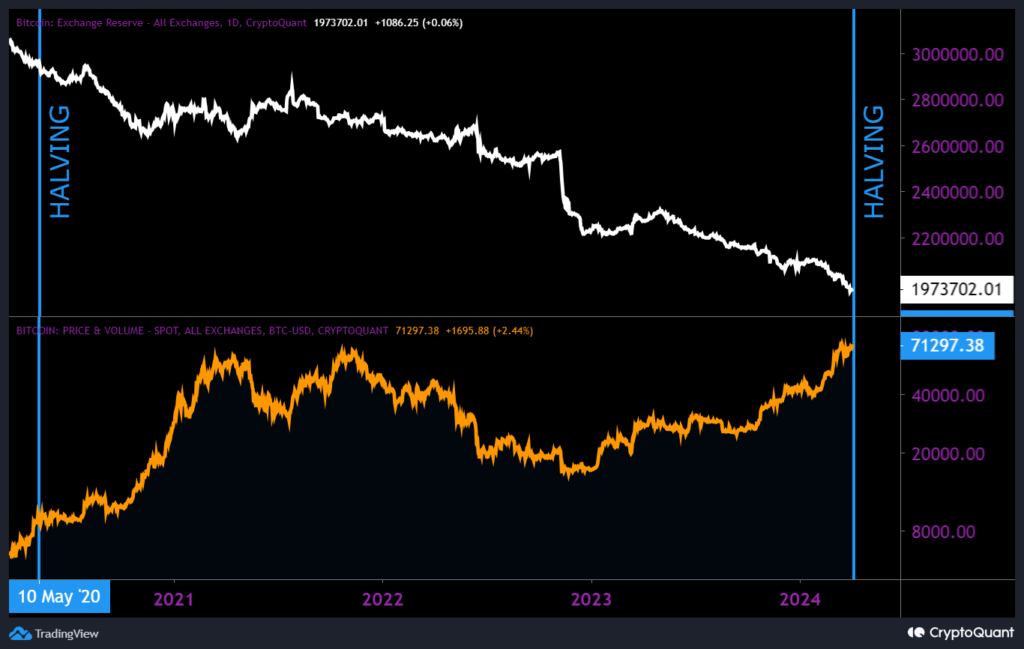
BULLISH: Supply of Bitcoin on Exchanges.
40% drop in exchange supply of Bitcoin since 2020. 5% drop year-to-date. With no signs of this trend slowing into the halving. Bitcoin price will get very spicy in the coming years if demand remains constant, or grows.
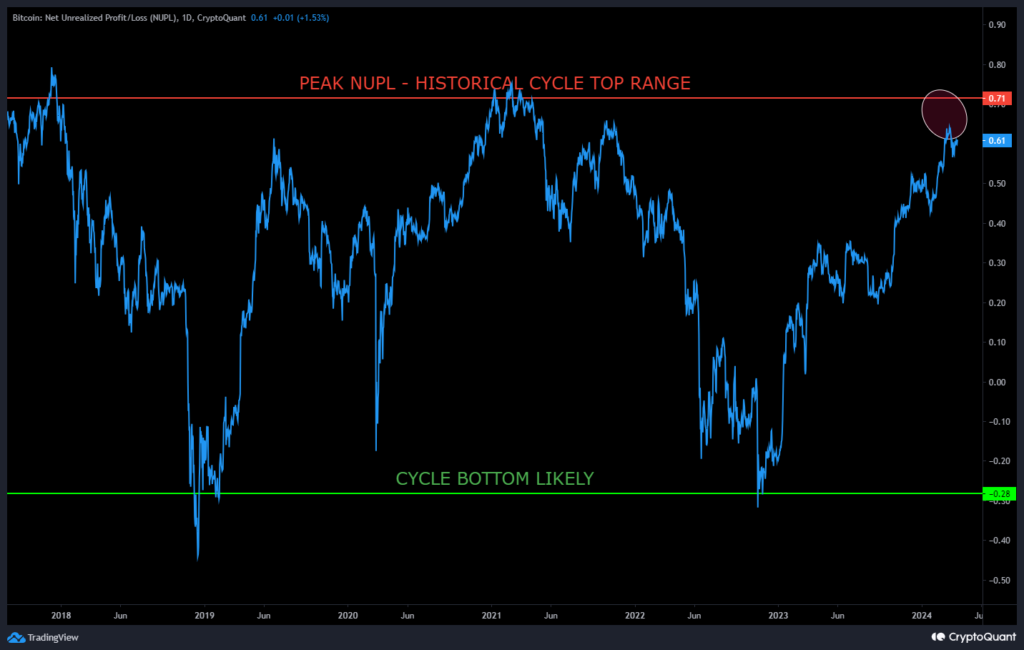
BULLISH: Net Unrealized Profit and Loss (NUPL).
No major change in the past week. At ~.60 reflects persistent greed & unrealized profit, but room to run before historical peak between 0.7 and 0.8. But note that its in what is historically the upper range for NUPL.
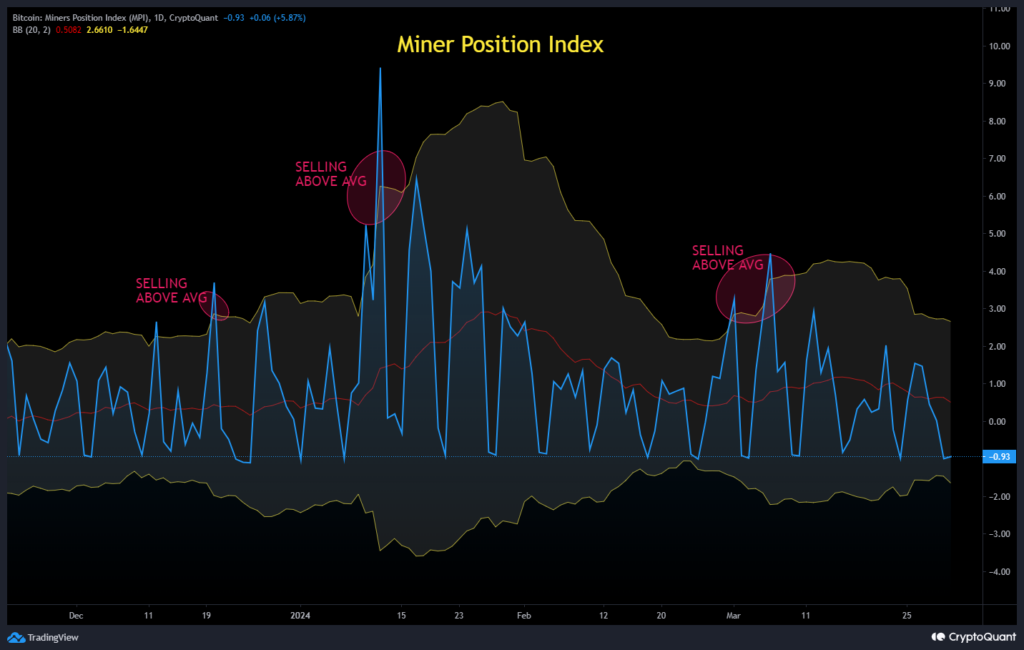
BULLISH: Miner Position Index (MPI).
No change from the past week. Miner selling pressure is in it’s fourth week of trending low. Miners are currently HODLing.
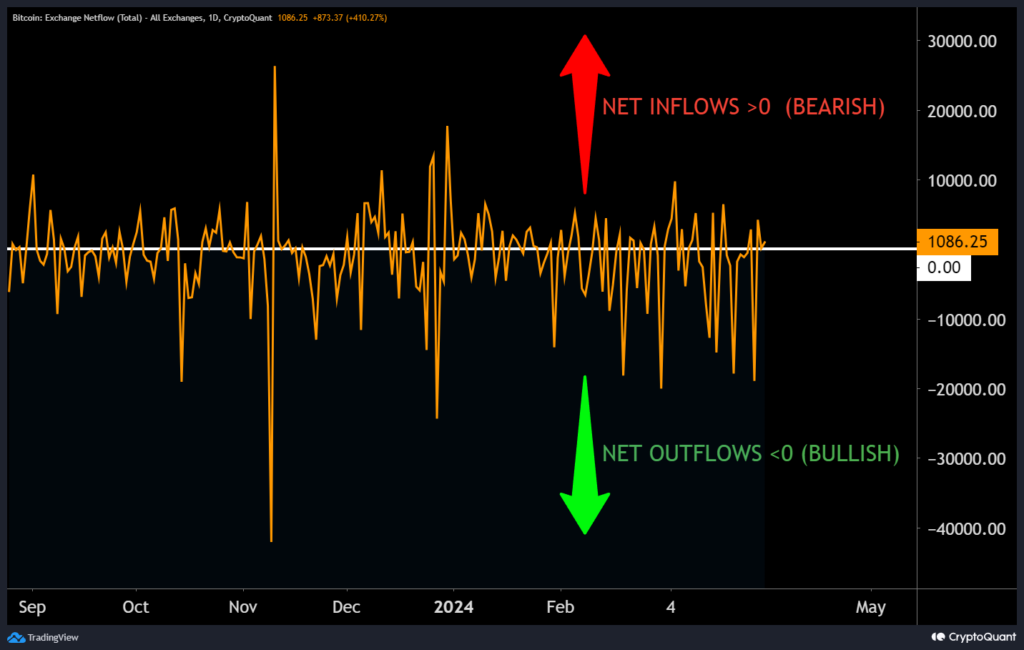
BULLISH: Bitcoin Netflow (All Exchanges).
No change in the past week. The market reflected predominantly outflows/buying, suggesting overall bullish sentiment.
BULLISH: Pi Cycle Indicator.
The Pi Cycle’s moving averages are trending bullishly, moving towards each other but not at risk of crossing yet. The 111 DMA isn’t forecast to cross above the 350 DMA x2 before Q4 2024.
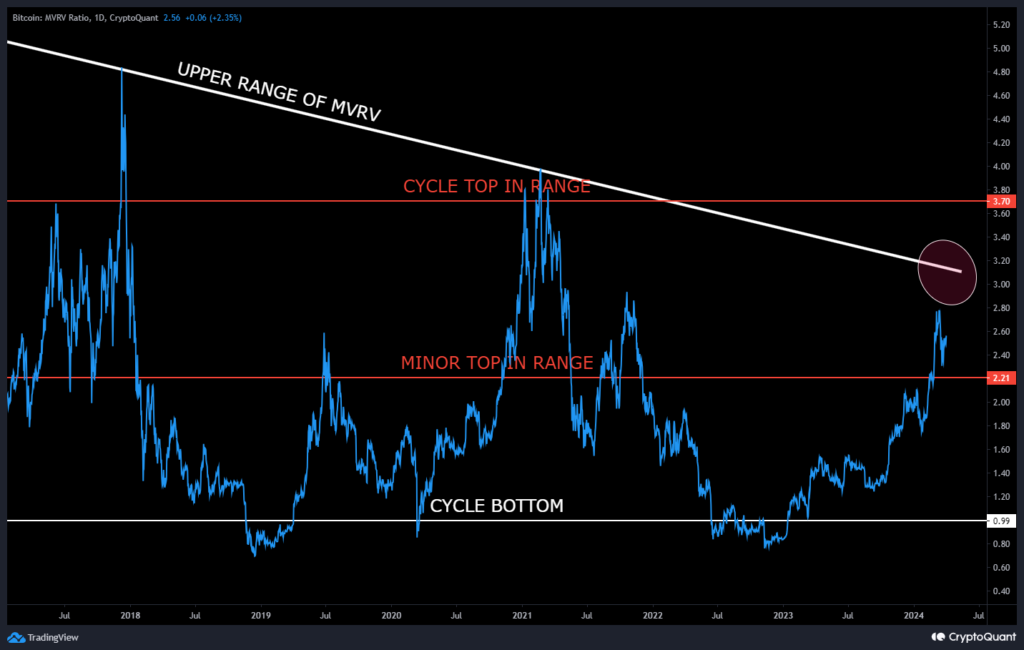
BULLISH: Market Cap to its Realized Cap (MVRV)
In recent weeks, MVRV continues it’s consolidation 20% to 30% below key rejection levels, suggesting room for the bull market to continue.
WEAKLY BEARISH: US Dollar Index (DXY).
The DXY continues to see some appreciation, but this isn’t due to fundamental strength in the US Dollar, as much as competing currencies growing weaker. I don’t expect this to turn into a larger rally, especially with the Fed considering rate reductions this year. However, it should still be monitored in case the macroeconomic climate changes.
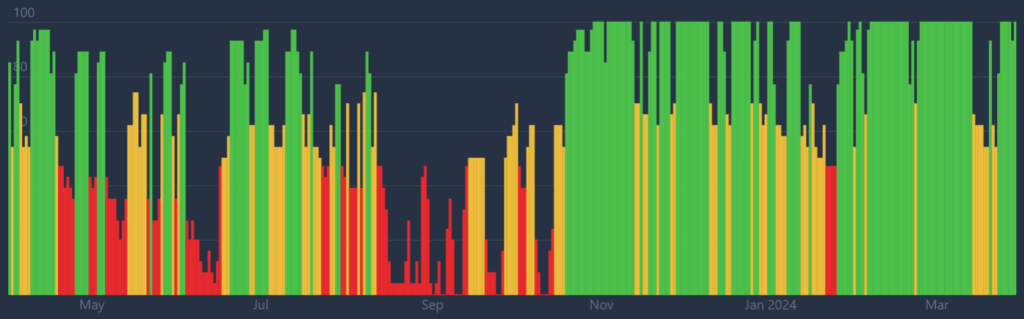
Market Sentiment
BULLISH: Market sentiment recovered this past week, after some cooling off through March. My Twitter feed is plenty evident of this, as the memecoin mania seems back in full [fool] force, this time rotating through BASE and even BASE L3 [DEGEN).
Other Sentiment Data
BULLISH: Coinbase App Ranking. Up slightly, about 40 points to 248 globally, and up a few positions to 14 among finance apps. Its trending bullishly, but not high enough to suggest a cycle top.
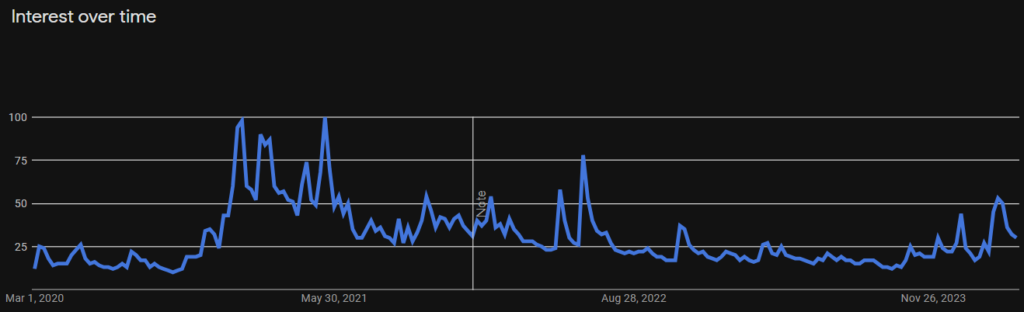
BULLISH: Google Trends. Bitcoin continues to grind it’s way up towards bull market levels, but isn’t high enough to suggest a cycle top.
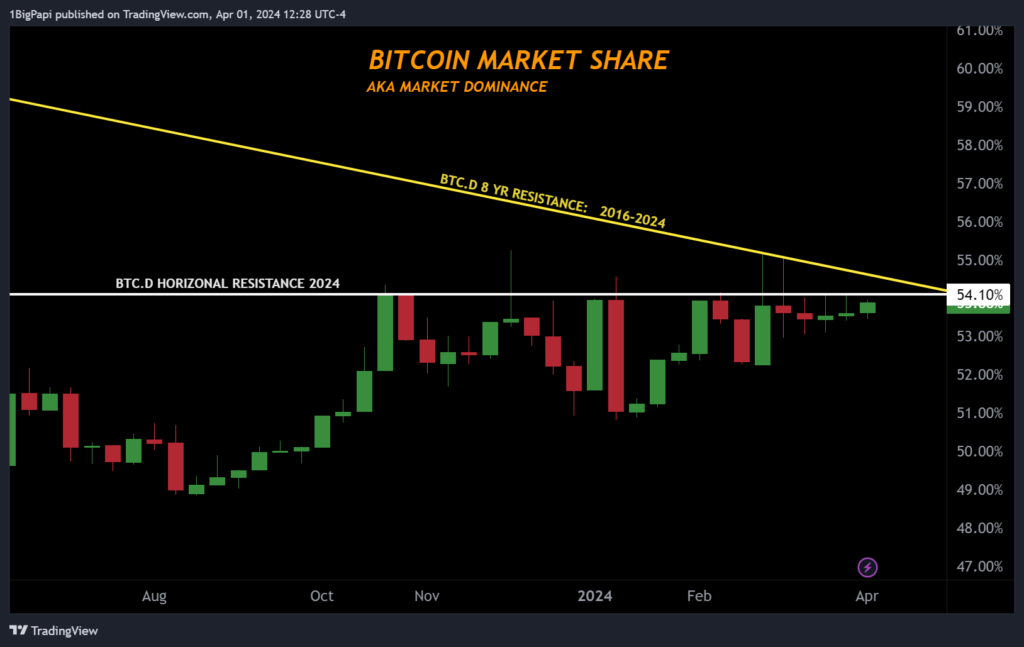
Bitcoin Dominance
No notable change from last week. Bitcoin remains stuck under 54% since last 2023. Its very possible Dominance will break out later this year, but until then we are likely to see altcoin narratives rotating through the market.
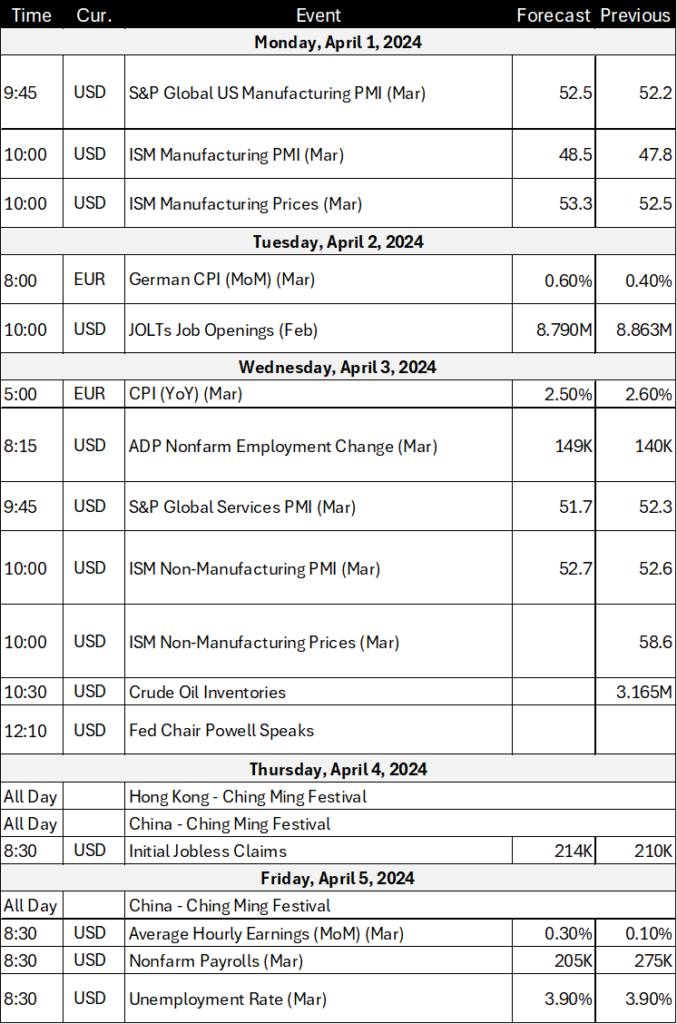
Crypto & Economic Calendar
The events below inform governments, corporations, traders and investors on the health of the economy. I only list events noted as “high volatility expected” in related markets.
Glossary of Terms
Below is an explanation of each indicator and data point I discuss above.
Bitcoin Dominance:
Bitcoin dominance is another way of saying “Bitcoin market share,” or how much of the total crypto market is Bitcoin. While not the clearest indicator, on lower timeframes, you can use this information to speculate when altcoins may rally. This is also described as an “alt season.”
Altcoin rallies often follow a local or major top on Bitcoin dominance and can last for several weeks or longer, while Bitcoin consolidates for the next move. The recent memecoin cycle is a form of altcoin cycle.
Bitcoin Supply:
Supply trends are simple- rising supply on exchanges implies bearish pressure, because it’s there to be sold, and the opposite true when supply drops.
More Bitcoin is being bought and HODL’d than is being mined, and this has been the prevailing trend since 2020. As we know with commodities, scarcity boosts perceived value. With a 40% drain on total supply since 2020, we are trending towards scarcity faster than ever.
While general supply trends can signal sentiment, did you know you can also account for localization? For example, in the last cycle, as we approached the top, Asian and international exchanges logged notable increases in supply, while America was net decline. Effectively this meant Asians left many Americans holding bags near the top.
Net Unrealized Profit and Loss (NUPL):
NUPL indicates the total amount of profit/loss in all Bitcoins, represented as a ratio. You can see why that makes for a handy data point, because as more of the market is in-profit, the risk of a retracement rises.
NUPL indicates a potential minor or major top when it rises over 0.75. Another way to think of this is as a greed tracker. The higher the NUPL, the greedier the market is, and eventually greed will turn to fear, as profit-taking cascades towards the end of a cycle or subcycle.
Miner Position Index:
Miners are among the smartest traders in crypto. For obvious reasons they need to optimize their selling to fund operations. Miners sell to fund operations, but will HODL supply when conditions permit, and sell heavily in the early to middle bull market.
MPI is the ratio of miner selling against the yearly average. If its rising strongly above the average, it suggests miners are worried about a top approaching expedite their selling. They do not try to land the top of the market, so they often sell in advance, which is helpful to traders trying to also time their exits.
Bitcoin Netflow:
Another fun data point is netflow. This shows the net result of a day’s inflows (moving Bitcoin to an exchange) and outflows (moving Bitcoin off an exchange).
The implication is that Bitcoin moved off exchanges is unlikely to sell. And as we approach tops, the netflows skew towards increasingly heavier inflows (moving to exchanges to sell).
Pi Cycle:
The Pi Cycle indicator is something many traders joke about, but there is no doubting it’s effectiveness.
It uses the crossing of two key moving averages (MA) to predict cycle tops: 111 DMA and 350DMA x2. It accurately called earlier cycle tops within a few days. The top signal is when the 111 DMA crosses above the 350 DMA x2.
Whether you believe these two MAs can predict cycle tops, its worth keeping an eye on it. As you can see, we still have time before the MAs converge.
Market Cap to its Realized Cap (MVRV)
MVRV is used to understand when the exchange traded price is below “fair value” by looking at the ratio between market cap and realized cap (approximates the value paid for all coins in existence).
This gives an idea of whether the market is fairly priced and can be used to identify potential tops and bottoms in the market. As with any indicator, don’t use it in isolation; look for confluence with other data.
A new component this cycle is the orange line, the top of the MVRV range, which reflects an increasingly smaller ratio over time. For the first time this cycle, the longer term diagonal resistance is lower than the generally acccepted upper range of 3.7 for cycle tops, so traders should monitor both.
US Dollar Index (DXY):
The US Dollar Index (DXY) is an index that measures the strength of the US Dollar. There is an inverse relationship between the DXY and speculative markets like crypto and equities. In general, when the DXY is up, crypto is down. The opposite is also true.
Of particular importance, the ~101 level, arguably the most significant for the DXY. Almost every time in the past 50 years, when DXY rejected from, or closed under the 101 range, it led to a prolonged period of weakening dollar.
If the fed drops rates in 2024, thats a strong signal that the DXY will continue to drop, and rates will inevitably decrease, its just a question of timing and whether they will start in 2024 or 2025. For rate decreases to occur in a year along with the Bitcoin halving would be particularly bullish.
Market Sentiment:
Economic events, political discourse, or general price action are all events that can impact sentiment. The market remains predominantly bullish since October 2023.
Sometimes market sentiment needs to cool off, otherwise bull markets can burn out too early. The market moves in waves of fear and greed, and too much of either can lead to pronounced moves in the opposite direction, which can further cascade due to leverage in the market.
Going into the election cycle, we can expect some volatility to accompany the crypto narrative, with players like Senator Warren building an anti-crypto coalition. It remains to be seen if this will have a bigger impact on sentiment than the increasingly accomodating macro.
Disclaimer: Nothing found on this website, or any sources linked to this website includes financial advice of any sort. We are not certified financial advisors, use our content at your discretion as entertainment, and as an educational resource. Do your own research.
If you enjoyed this article and want more hot takes and interesting posts about the economy, web3, crypto, decentralized finance, NFTS and more – follow Papi on Twitter/X at https://twitter.com/1MrPapi.