
Last week we challenged the many influencers who suggested the cycle was dead, dying, or destined for $40k. Bitcoin ended up bouncing at $58k for a June close along $62k. And this week I see renewed signs of a sideways summer (for now).
We’ll review recent news, fud and technicals, and you can decide how bearish or bullish you feel afterwards (or skip to the end if you are in a rush):
Mt. Gox Distribution:
Mt. Gox distribution has been making headlines for 7 years. Conveniently this (often) trends on social media at key Bitcoin support levels. When price drops, human psychology drives us to seek a narrative or reason for it.
The facts: Mt. Gox Bitcoin will enter markets starting this month, through October 2024. Mt. Gox has ~142,000 Bitcoin. If you distribute that value over 4 months, thats around 1,200 Bitcoin daily. Comparatively, an average day in June saw around 20,000 Bitcoins flowing into exchanges, largely absorbed.
And as many analysts noted- even when they sell, its not like billions of dollars in Bitcoin will be sold in a single market order. It will be months of trickling sales, and many will just HODL. But the absolute worst case scenario? This is where the top holders dump as fast as they can- I estimate we land back around $52k, the bottom of a majorly bullish value range extending from $59k down to $52k.
Germany Distribution:
Germany was in possession of over 40,000 BTC. They continue selling. No public statement was made regarding timing or amounts, so we are assuming worst-case scenario that all of it will come to market.
Germany moved ~2,700 Bitcoin to exchanges over the past three weeks, and still holds over 44,000 BTC. If they continue to sell at this pace, it would take around 9 months to sell everything. At that pace it has no meaningful impact on flows or bearish pressure on markets.
The biggest impact appears to be the semantic. The visibility of this selling has some bearish connotations, as one of Bitcoin’s narratives is that nation states will stack Bitcoin in the face of a diluted US Dollar.
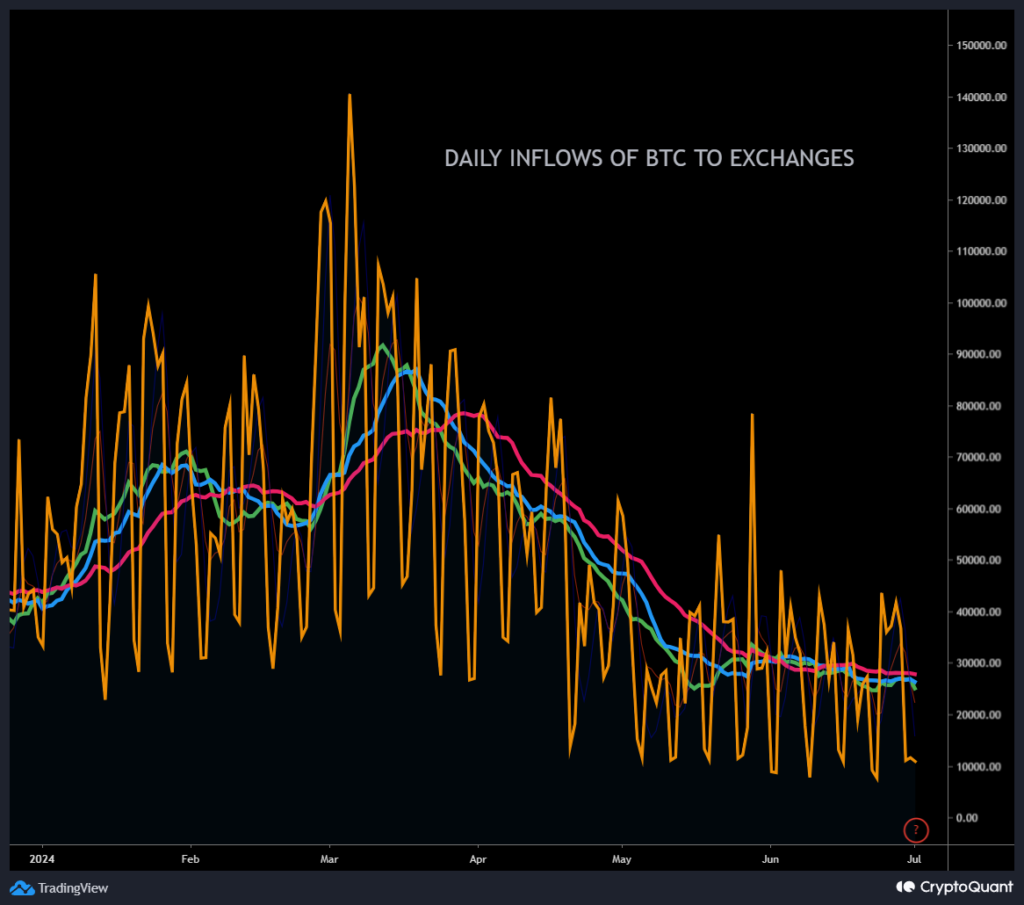
For a little perspective, below is the daily inflow of Bitcoins to exchanges, declining month over months in 2024.
Supply on Exchanges:
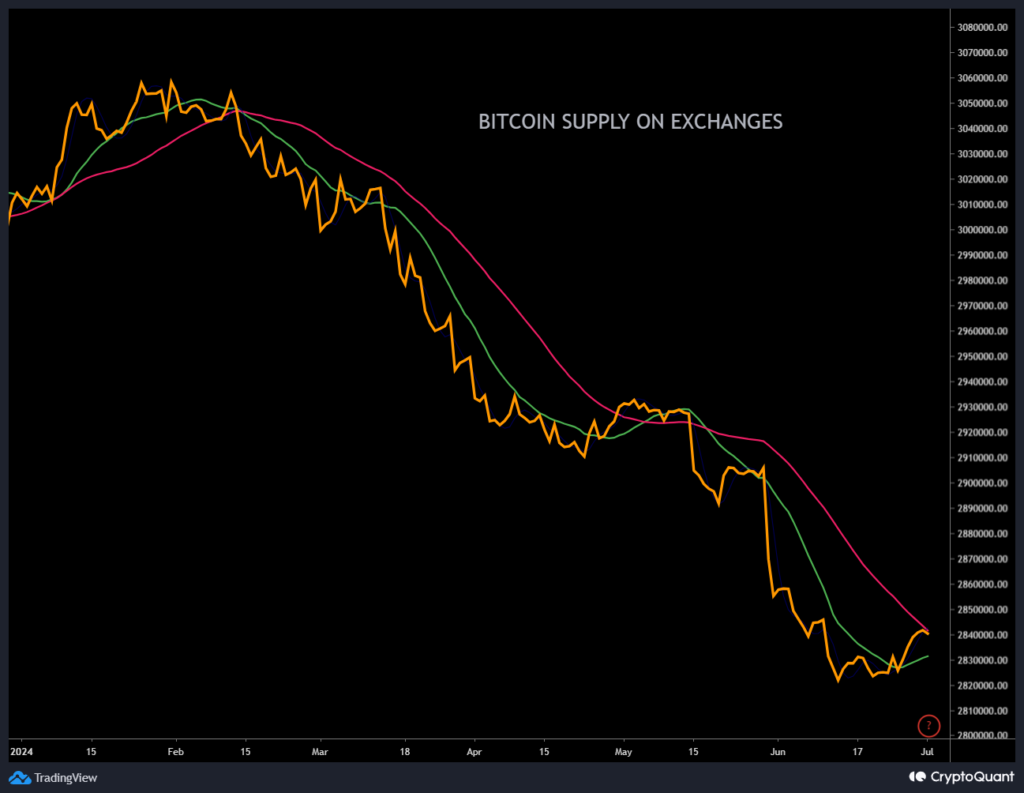
Since the Germany inflows and Mt. Gox started trending in mid June, we’ve seen a less than 1% rise in supply on exchanges, which is statistically insignificant. On higher timeframes we continue the multi-year trend of declining supply.
That said, flows change and depending on the pace of selling by Germany and Mt. Gox over the next month, we may see supply rise at a faster pace through summer. But with the addition of ETF flows and increasing adoption from retail, on higher timeframes I don’t expect Mt. Gox or Germany to influence the continued decline in supply on higher timeframes- I think we’ll see a sideways trend on Bitcoin supply, worst case.
We may see lower timeframe volatility and rising supply intraweek or intramonth, but across the year of 2024, Bitcoin will continue to march towards an inevitable supply crunch this decade, maybe much sooner, where there simply isn’t Bitcoin remaining on exchanges for everyone that wants it.
Note that while I discuss Bitcoin here, we see similar trends for Ethereum, which has an additional benefit of having deflationary economics over a certain level of utilization.
Bitcoin Market Structure:
So this is where it starts to get interesting. First lets talk historic data: historically Bitcoin averages a 9% appreciation in July. Compound that with growing confidence that peak inflation is behind us (according to the US Government) and rates could reduce rates by Q4.
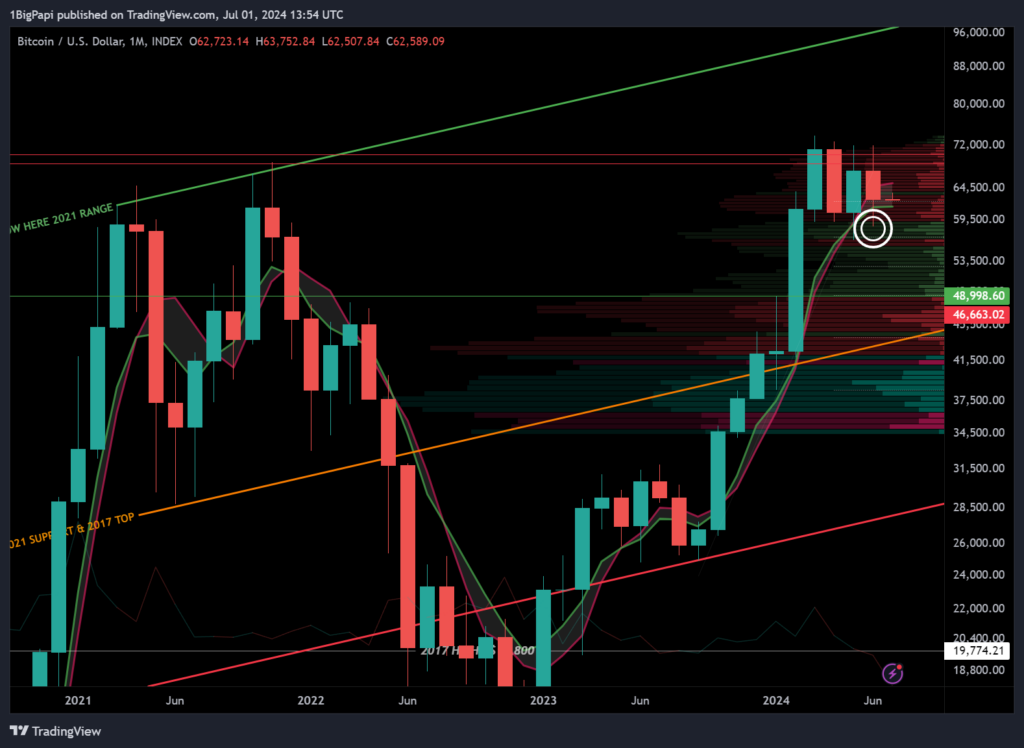
Bitcoin penetrated the 20w SMA and 21w EMA, collectively known as the “bull market support band” last week. These moving averages historically act as support during bull markets. Its not unheard of for price to pierce that support intramonth, but bulls want to recover and close in or over that band ($61.5k at lowest).
If you followed last week’s article or my Twitter, we discussed the importance of $58k as support, and were looking for a bounce there, which we got. The question is whether we continue the recovery towards the $70k resistance. That will depend on how Mt. Gox continues to play out, and how the PMI (Purchasing Managers Index) data comes back, which is another indication of inflation.
On a higher timeframes, sideways Summer is looking increasingly likely, with a possible range between $50k and $70k, at least for the first half of summer. Bullish invalidation if we close a monthly over $71.3k.
Macroeconomic:
You’ve probably seen commentary about the Japanese versus Dollar, and how the Yen is struggling against the Dollar, potentially leading to a collapse of the Japanese Yen.
There is absolutely a scenario where that could cascade to larger macro instability, and I’m not qualified to comment on it in-depth.
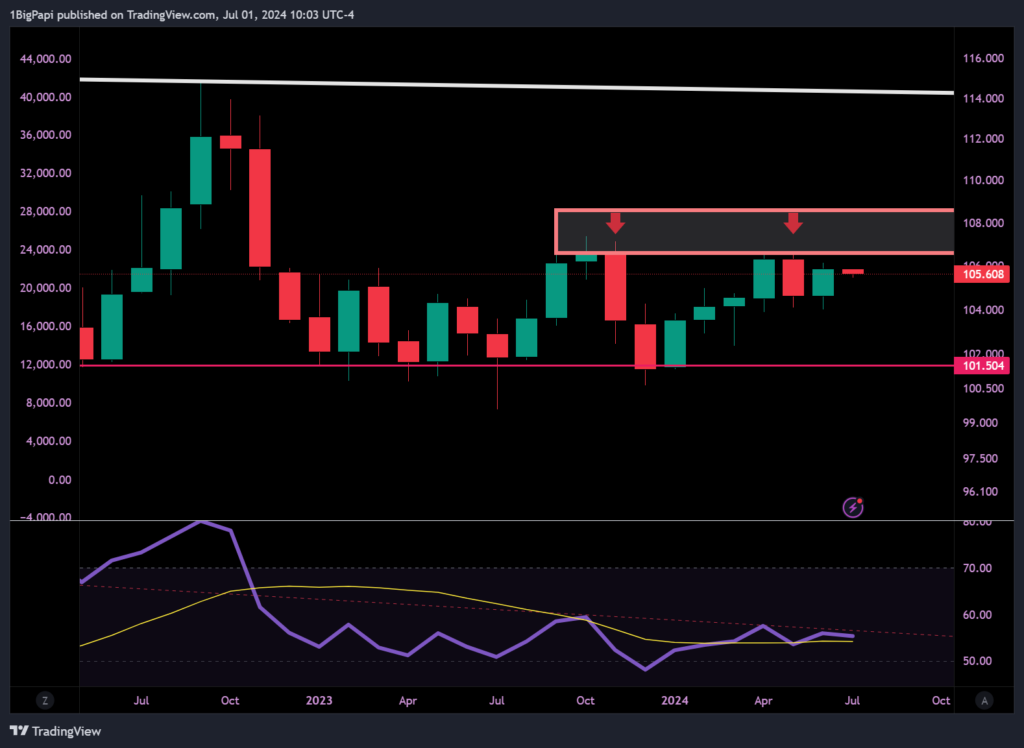
But one positive possibility worth acknowledging – the US Dollar is at the end of a rate cycle, with the US Dollar Index (DXY) showing clear signs of decline on higher timeframes. It logged several rejections as it falls closer to losing the key support along 101.5.
For us to achieve this, we want to see continue relief on inflation data like CPI, PPI, PMI. So far recent data came back accommodating, and going into an election cycle, the Government has extra incentives to report on it positively, likely adding a little extra fuel to our bullish narrative.
If the DXY continues it decline, that alleviates pressure on the JPY, which could avoid a larger economic disaster, with the added bonus of boosting crypto and speculative markets. And Japan is not unique, even the US is suffering with a stronger dollar in light of a rising sovereign debt.
So what’s next?
From a price perspective, accounting for all probabilities, you could see price anywhere between $50k and $70k, with a short term bias early this week of a little bounce.
For background: I’ve been DCA’ing into the market since 2022. My entire strategy is to stack spot until we approach the end game for the cycle, then cash out. In my opinion the end of cycle is still a ways out.
On days/weeks like today, I’ll log in and manually stack extra. Today I already made a few buys.
Possibilities for the remainder of 2024:
- [Most Likely] sideways summer; we see continued chop and shake out paperhands and overleveraged traders before the Fed pivots in Q4 (possibly).
- [Least Likely] sink notably lower in the near term; we see the macro instability in currencies like the JPY accelerate, bumping the DXY higher and sinking risk assets like crypto.
- [Moderately Likely] rally hard into summer; we see the macro stabilize, more good news on inflation comes, and markets try to front-run the Fed rate decision at end of summer by buying now.
Why do I choose sideways summer as most likely? Largely timing and sentiment. The end of the rate cycle also correlates to historic Bitcoin trend of lengthened cycles which call for a cycle top by Q1 2025. Additionally, searches for Bitcoin and crypto are largely in decline after peaking in March. Data shows a great deal of correlation with mid-cycle consolidation, and very little with the end of a cycle.
Keep in mind that once this cycle peaks, there is a good probability that the macro climate will destabilize and we fall into a recession or worse.
So timing this cycle’s exit is important, but everything until then is just noise imo.. and right now nothing indicates the end of the cycle here.
Enjoy this? You can follow me at my OG account on X/Twitter @1mrpapi or my crypto-only account at @thectpapi