
Crypto & Economic Calendar
Be advised that events listed below inform corporations, traders and investors on the health of the economy, which can lead to volatility in markets and currencies. Only experienced traders should trade around these events.
- Monday
- [UK] Banking Holiday
- Tuesday
- 1200 ET: [USA] Short-Term Energy Outlook
- Wednesday
- 0200 ET: [EUR] German Consumer Price Index (CPI) (April)
- 0830 ET: [USA] CPI (YoY and MoM)
- 1030 ET: [USA] Crude Oil Inventories
- Thursday
- 0700 ET: [UK] Interest Rate Decision
- 0830 ET: [USA] Jobless Claims
- 0830 ET: [USA] Producer Price Index (PPI)
- Friday
- 0200 ET [UK]: Gross Domestic Product (GDP) (YoY, MoM and Q1)
Bitcoin Pullback From Key Levels

Note we continue to use the BTC:USD chart adjusted for the USA M2 money supply, due to more precise representation of high-timeframe key levels; and accounting for a variable money supply and it’s impact on price Chart: BTCUSD/FRED:M2SL*22
The ongoing consolidation of Bitcoin under $30,000 persists as the cryptocurrency market navigates a period of uncertainty. The key support level established during the 2021 cycle now serving as resistance, and blocking upward momentum. Consequently, Bitcoin continues ranging between $27,000 and $30,000. Further pullbacks are possible and even likely, with support levels ranging from $26,500 down to $24,500, which could still support a bullish thesis, but on a longer timeframe.
If bulls lose $27,000, attention will likely shift to the range spanning $25,200 to $24,500. This zone aligns with the 50% Fibonacci retracement level, February’s peak prices, and the historical bull market support band of moving averages (20 and 21-week). That makes this the most likely and most important level for bulls to defend.
More bullish analysts maintain Q2 -Q3 price targets between $35,000 to $40,000, with a few outliers forecasting higher than $40,000. A weekly close above the $27,000 mark would be positive new for bulls, showing consolidation just below $30,000, potentially sustaining the upward trajectory that began in Q4 2022.
However, a closure below $27,000 potentially signals the start of a new trend, leading to a retest of support levels at $26,400 and within the $25,200 to $24,500 range. While some extreme predictions are again surfacing, suggesting a drop below $20,000, such lows seem improbable given the role of FTX and Luna in driving the market to that point. In a most bearish scenario, prices could momentarily dip into the teens intraweek, but wouldn’t last long.
Note at the end of the article we have tips for protecting your capital in the event of major downside moves. Trade smartly, manage risk and protect your capital – thats the key to success.
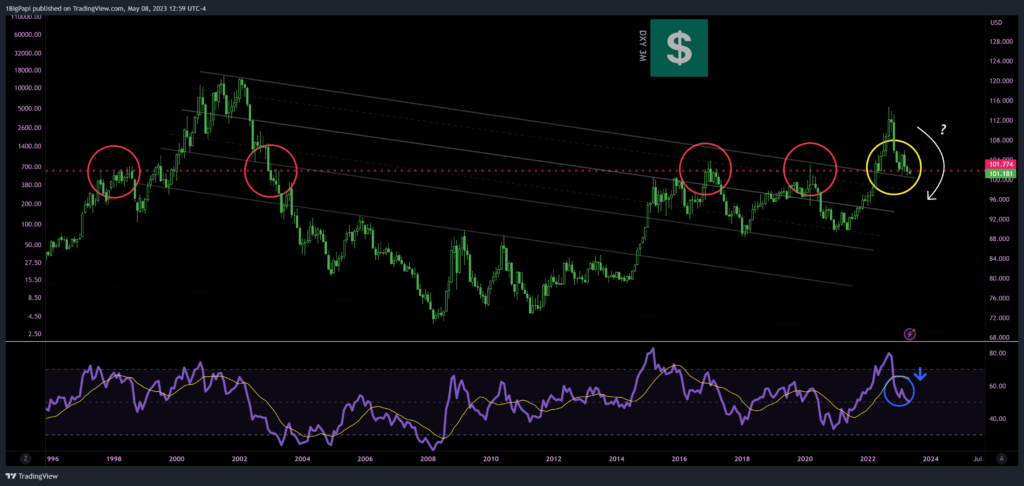
US Dollar Index (DXY)
As noted in our previous update, the US Dollar (DXY) is contending with bearish pressures and a potentially less hawkish Federal Reserve. It remains rangebound at the historically significant 101 level. On seven occasions over the past four decades, a close below 101 resulted in a downtrend lasting at least one year.
Although the DXY is flirting with sub-101 levels, it consistently closes above the diagonal support extending from 2002. This pattern suggests the possibility of a relief rally before any further decline.
To confirm a sustained downtrend, we need to observe a monthly close below 100.4. With peak interest rates potentially upon us and recent banking instability causing some capital flight from US banks, it appears likely that the dollar will continue to weaken in the upcoming months. The precise timing of any major momentum shifts will depend on economic data from the US, EU, and other major economic powers.
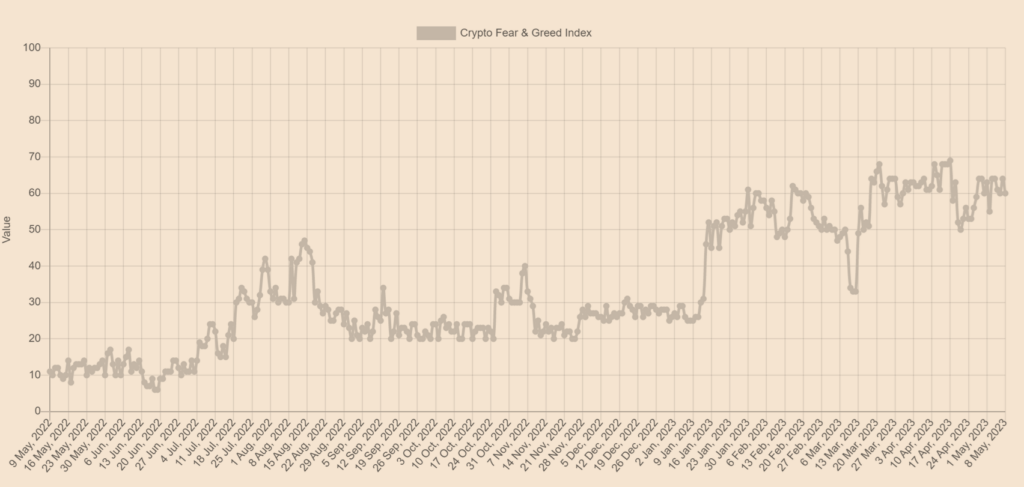
Market Sentiment
The Cryptocurrency Fear and Greed Index peaked at 69 two weeks ago, before dropping back into the 60s. This indicates moderate greed, with the retreat from highs in April reflecting the current indecision in markets, as recessionary worries and banking instability is spooking some investors.
Though trading solely on the Greed and Fear Index is challenging, it holds significance when correlated with other data points or when approaching key levels.
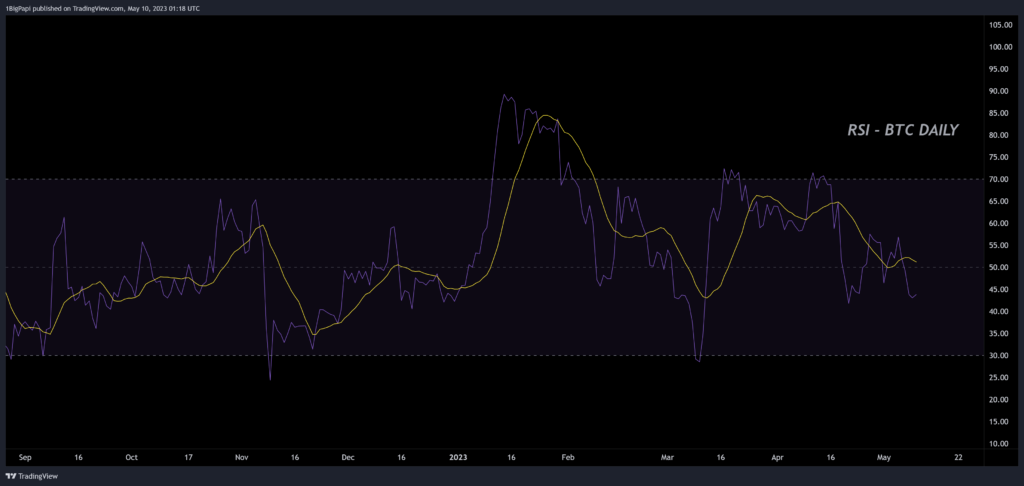
Bitcoin Momentum
Bitcoin momentum reflects a waning bullish sentiment. The Relative Strength Index (RSI) displayed lower highs and a bearish crossover in momentum between April 13th and 16th, which could potentially signal an impending downward move in the upcoming week(s).
The current price action appears to lag momentum data. The RSI experienced a 40% decline at its peak and exhibited a bearish trend since mid-April, while the price of Bitcoin continues to consolidate in a neutral to weakly bullish bias.
Considering the divergence in momentum, further downside appears more probable, with key levels identified above on the Bitcoin chart.
Momentum is likely to shift to a strong bullish stance in response to any news that leads to a decline in the DXY, including a more dovish stance from the US Federal Reserve, easing recessionary concerns, resolution of the Ukraine conflict, or a combination of these factors.
Memecoin Mania
Last week we saw one of the most spectacular runs in crypto history, as PEPE, a memecoin launched mere weeks ago, go parabolic and land itself on the largest crypto exchange in the world – Binance.
PEPE made a lot of people a lot of money, but it also birthed a short cycle of memecoin mania, where you can see dozens of new tokens launched daily, virtually all with zero-utility, zero-roadmap promises, and a lot of hype and memes.
I can’t say this loud enough – BE VERY CAREFUL. I estimate 2/3 of these will rug, either intentionally or simply by failing to launch. There isn’t enough liquidity for another memecoin to repeat PEPE’s performance in the near term. Protect your capital, don’t gamble it.
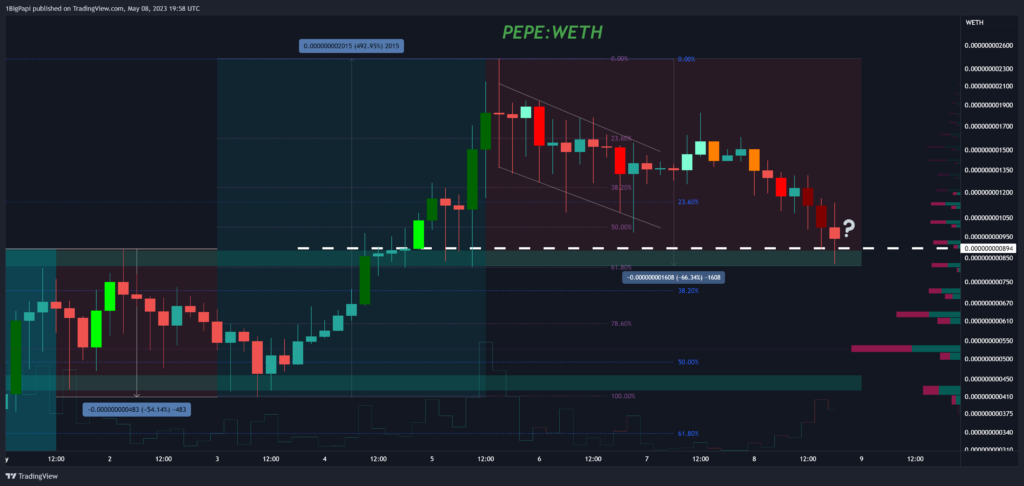
In terms of PEPE price action and the chart – it looks sickly here. It is currently exhibiting it’s heaviest selling ever, it gave up key support levels, it logged a lower high and lower low – and it’s generally correlating with the larger market, which is short-term bearish.
However all is not lost. In the near term we may see news of Coinbase listing lift it back up for another rally. And given that most PEPE buyers are in the US, and Coinbase doesn’t offer derivatives (ie. short selling), it is likely a short term injection of bullishness if Coinbase picks it up.
Without a Coinbase listing, you need to decide if you are in it long term. Its hard to say where price will settle after a parabolic manic fueled rise. The white level marked on my chart is what I consider the bull’s last support before this potentially flips from an uptrend to a pronounced downtrend.
I suspect PEPE will be an important performer in the next bull market, but the “get rich quick” phase appears likely played out here. Also many derivative traders (and perhaps even Binance itself) are stacking shorts in this range as fear peaks.
Trading Tips
Note: we provided this tip last week, but keeping it up one more week. If you haven’t experience large downside moves before, here are some tips:
- If you are stacking spot or using a Dollar Cost Average (DCA) strategy, reduce your buying interval until we see momentum like RSI or TSI reset on the daily or weekly, or for the Fear and Greed Index to drop.
- If you are swinging spot, monitor your stoploss and profit targets; be more judicious about moving them with price to avoid getting caught by sudden pivots in the market and maximize profit.
- If you are day-trading or margin trading, you shouldn’t be too impacted. Just be careful not to marry a directional bias, like looking for longs when the market suggests it’s reversing. Its easier to trade the prevailing trend than against it.
- If you are staking and have a large amount of rewards to claim, consider moving a portion into BTC, ETH or stablecoins over time. This will hedge against large downside moves in the future as BTC and ETH tend to be less impacted.
If you enjoyed this article and want more hot takes and interesting posts about the economy, web3, crypto, decentralized finance, NFTS and more – you can follow Papi on Twitter at https://twitter.com/1MrPapi.
Disclaimer: Nothing found on this website, or any sources linked to this website includes financial advice of any sort. We are not certified financial advisors, use our content at your discretion as entertainment, and as an educational resource. Do your own research.