Crypto & Economic Calendar
Be advised that events listed below inform corporations, traders and investors on the health of the economy, which can lead to volatility in markets and currencies. Only experienced traders should trade around these events.
- Tuesday
- 0930 ET: [USA] Building Permits
- 1000 ET: [USA] Consumer Confidence
- 2130 ET: [AUS] Consumer Price Index (CPI)
- Wednesday
- 0830 ET: [USA] Core Durable Goods Orders
- Thursday
- 0830 ET: [USA] Gross Domestic Product (GDP) Q1
- 0830 ET: [USA] Initial Jobless Claims
- 2300 ET: [JPY] Monetary Policy Statement and Outlook
- Friday
- 0355 ET: [DEU] GDP Q1
- 0800 ET: [DEU] CPI
- 0830 ET: [USA] Core Personal Consumption Expenditures (PCE) Index
- 0830 ET: [CAD] GDP MoM
- Saturday
- 2130 ET: [CNY] Manufacturing Purchasing Managers Index (PMI)
Bitcoin Pullback From Key Levels

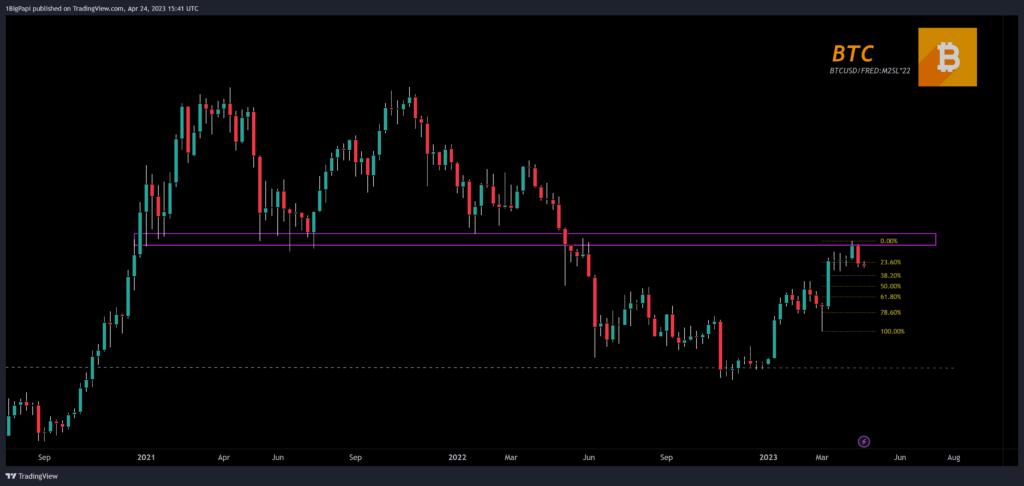
Bitcoin’s retracement persists after surpassing the $30,000 mark. This week we are sharing a little alpha – we’ll shift our focus from the standard/default chart to the BTC:USD chart adjusted for the USA M2 money supply, which typically offers a more precise representation of high-timeframe key levels while accounting for the variable money supply’s massive inflation in recent years.
The M2 adjusted Bitcoin chart shows the $30k rally rejected at the 2021 cycle support, subsequently dropping by 10% to $27,000. There is a high possibility of additional downside, but remains well within a healthy retracement range. The immediate support in this range is mid to lower $26,000.
But keep an eye on the range between $25,200 and $24,500, as it represents a potential 7.5% to 10% drop, coinciding with the 50% Fibonacci retracement level and February’s highs. This range also perfectly aligns with the historic bull market support band of moving averages (20 and 21-week MAs).
Numerous bulls maintain their Q2 targets in the $35,000 to $40,000 range, with a few outliers predicting figures higher than $40,000. A weekly close above $24,000 would likely favor the bulls, whereas closing below $23,000 could lead to more significant downside and validate bearish momentum.
Following the 10% drop last week, bears are rallying, with most anticipating levels between $25,000 and $20,000. Although extreme predictions suggest lows of $10,000, it’s unlikely that we’ll see such prices, considering that neither FTX nor Luna could drive the market that low. In a bearish scenario, prices in the teens are possible intraweek but unlikely to persist.
Note that while I believe a large downside event towards $10k unlikely, its best to be prepared – at the end of the article we have tips for protecting your capital in the event of big red candles.
US Dollar Index (DXY)
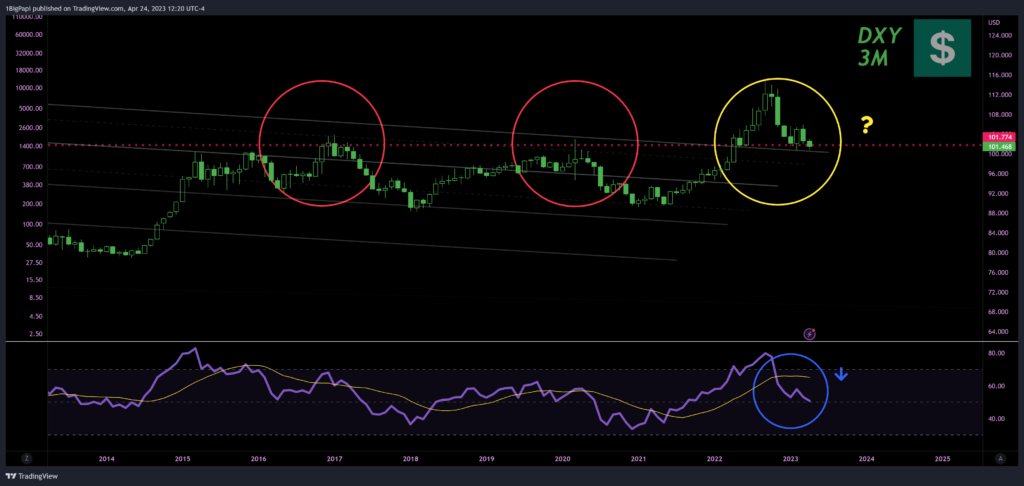
The US Dollar (DXY) is experiencing slowing bearish momentum as it remains rangebound at the historically bearish 101 level. Over the past forty years, whenever the Dollar closed below 101, it trended lower for at least a year.
Recently, the DXY dipped below 101 twice and seems poised to decline further in the coming weeks. However it may experience an upside retracement first as it nears a critical support level extending from the early 2000s. The direction and velocity depend on US and EU economic data, we’ll continue monitoring for USD sentiment indicators.

Market Sentiment
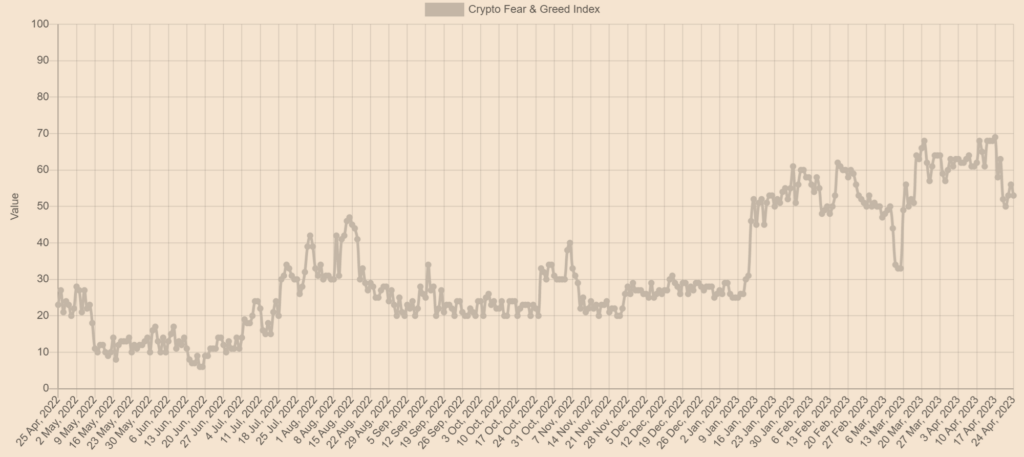
As mentioned last week, greed levels at 70 or higher typically precede significant downside. Greed peaked at 69 a week ago before the market dropped almost 10% in the subsequent days.
Though trading solely on the Greed and Fear Index is challenging, it holds significance when correlated with other data points or when approaching key levels.

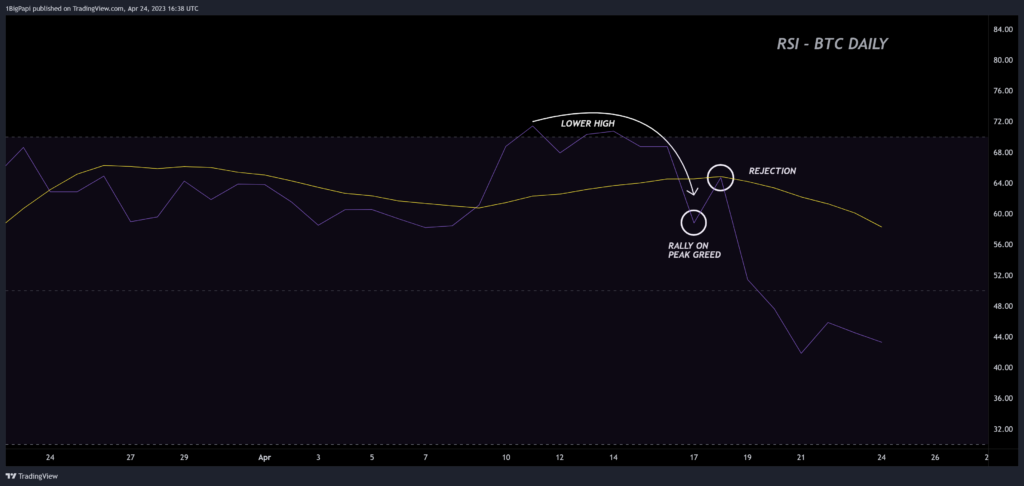
The current Bitcoin momentum reflects the diminishing bullish sentiment. The Relative Strength Index (RSI) exhibited lower highs and a bearish cross on momentum between April 13 and 16, possibly predicting an upcoming downside move.
On April 17, the Greed Index peaked at 69, and sentiment surged, prompting an RSI recovery attempt. Regrettably, the bullish momentum faltered the next day, with bearish momentum resuming and continuing downward, correlating with the decrease in sentiment.

Trading Tips
Note: we provided this tip last week, but keeping it up one more week. If you haven’t experience large downside moves before, here are some tips:
- If you are stacking spot or using a Dollar Cost Average (DCA) strategy, reduce your buying interval until we see momentum like RSI or TSI reset on the daily or weekly, or for the Fear and Greed Index to drop.
- If you are swinging spot, monitor your stoploss and profit targets; be more judicious about moving them with price to avoid getting caught by sudden pivots in the market and maximize profit.
- If you are day-trading or margin trading, you shouldn’t be too impacted. Just be careful not to marry a directional bias, like looking for longs when the market suggests it’s reversing. Its easier to trade the prevailing trend than against it.
- If you are staking and have a large amount of rewards to claim, consider moving a portion into BTC, ETH or stablecoins over time. This will hedge against large downside moves in the future as BTC and ETH tend to be less impacted.
If you enjoyed this article and want more hot takes and interesting posts about the economy, web3, crypto, decentralized finance, NFTS and more – you can follow Papi on Twitter at https://twitter.com/1MrPapi.
Disclaimer: Nothing found on this website, or any sources linked to this website includes financial advice of any sort. We are not certified financial advisors, use our content at your discretion as entertainment, and as an educational resource. Do your own research.
