
By Maugie
–> Maugie on Twitter
–> Maugie’s Crypto Viking Server
Click for Audio Read!
The Solana Surge: A Technical Analysis Breakdown
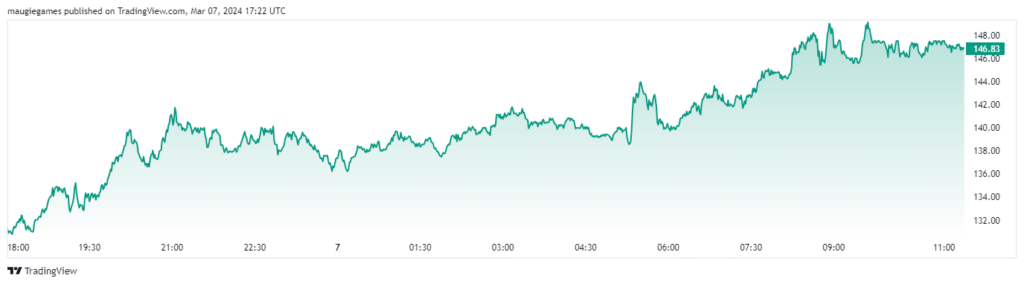
Solana (SOL) has been on a remarkable run, catchin’ the eyes of crypto enthusiasts far and wide. Let’s dive into the numbers from the past month, week, and the last 24 hours, based on Binance data, to get a good look at where Solana might be headin’.
Monthly Momentum: A Spectacular Surge
Over the past month, SOL has seen an eye-poppin’ price jump of 606.68%, with its price hittin’ $147.06. This phenomenal growth, coupled with a volume of over 62 million SOL, has got folks talkin’. TradingView’s strong STRONG BUY signals across the board reflect the market’s solid confidence in Solana. Despite some indicators pointin’ towards overbought territory (CCI at 156.72), the majority bullish indicators, such as an RSI of 73.77 and an MFI of 90.1, underscore a robust upward push.
Support and Resistance
- Support Levels: 123.325, 114.1875, 108.375
- Resistance Levels: 134.2909, 137.8191, 143.53
Weekly Analysis: Consistent Bullish Sentiment
Zoomin’ in on the past week mirrors the monthly view, with Solana markin’ a 44.7% rate of change and a slight uptick in price to $147.19. The analysis continues to favor a STRONG BUY recommendation, backed by bullish indicators and a slightly higher RSI of 78.76, indicatin’ sustained buyer interest and potential for continued growth.
Key Observations
- Volatility has dipped to 12.98%, suggestin’ a stabilizin’ trend.
- Market cap and tradin’ volume stay strong, bolsterin’ investor confidence.
Daily Dynamics: The Latest Snapshot
The last 24 hours show a nuanced picture. While Solana’s price slightly dipped to $146.94, the rate of change was still a significant 33.7%. The consistency in STRONG BUY ratings persists, though the STOCH indicates a bearish crossover, and the ADX points to a weaker bullish trend. This could suggest a coolin’ off period or consolidation after the recent highs.
Noteworthy Trends
- Volatility’s down to 7.35%.
- SMA (50) and SMA (100) have turned bullish, contrastin’ with the monthly data.
Where is Solana Headin’?
Solana’s trajectory has been nothin’ short of remarkable. The alignment of bullish indicators across different timeframes signals a strong upward momentum, albeit with caution due to some overbought conditions. The recent bearish crossover in STOCH and a less pronounced ADX trend in the daily analysis may hint at a short-term consolidation phase.
Predictive Outlook
Considering the current data, Solana may continue its bullish trend but could experience short-term fluctuations. The key will be keepin’ an eye on them support and resistance levels for potential breakout or retracement points. Y’all should keep a watch on volume changes and the broader market sentiment as indicators of SOL’s next big move.
Disclaimer: This article is for informational and entertainment purposes only. It is not intended to be financial advice. The views expressed are those of the author and do not necessarily reflect the official policy or position of any agency or company. Cryptocurrency investments are volatile and high risk in nature. Don’t invest more than what you can afford to lose. Before making any financial decisions, consult with a qualified professional.