
Bitcoin – Sitting at All Time Highs (feels good)
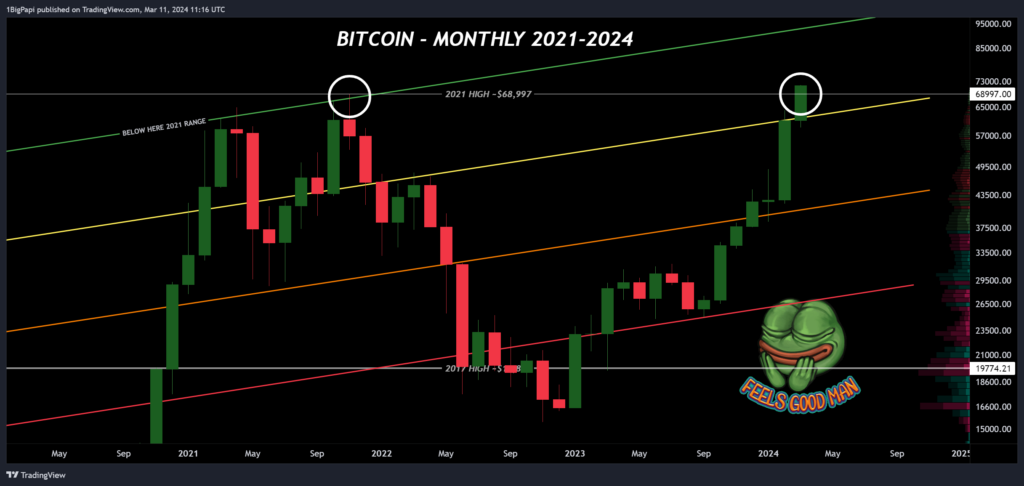
Summary: Our premise was simple: price over $35k is an uptrend, over $44k is bullish, and under previous highs, keep stacking. But now we are over previous highs. So whats next?
First, we look for confirmation. We’ll get that on the monthly chart when the month of March closes. Then, once Bitcoin confirms a close over $70k, we rethink our strategies, and begin to monitor for top signals.
If you are a LOW RISK spot holder, this is where you start planning your exit. Just like averaging into buys, we also average out as you sell. If you sell at once and too early, you will miss out on considerable gains. You can Google strategies, but it will be something like XX % per week/month. Timing and duration is based on your personal goals and risk tolerance. You can accelerate this if you suspect a major top is approaching.
If you are still buying spot, keep in mind that the risk/reward of buying skews less favorably once Bitcoin enters price exploration above $70,000. Midrange trades remain more viable, especially with altcoins at key parts in the cycle, such as when Bitcoin is at major resistance. Maintain tigher stoploss or invalidations for your trades (ie. lower your risk profile where you can).
| Note that throughout the bull market, different narratives will run as subcycles, for example- memecoins are currently popular, but that will rotate to something else eventually. Potential narratives: elections, artificial intelligence, DeFi, layer 1, layer 2, gaming, art, memes, ETFs. |
And if you are a day trader, simply respect the overall market bias is to the upside for the foreseeable future, potentially into 2025. There will be corrections but I recommend trading with the market, not against it.
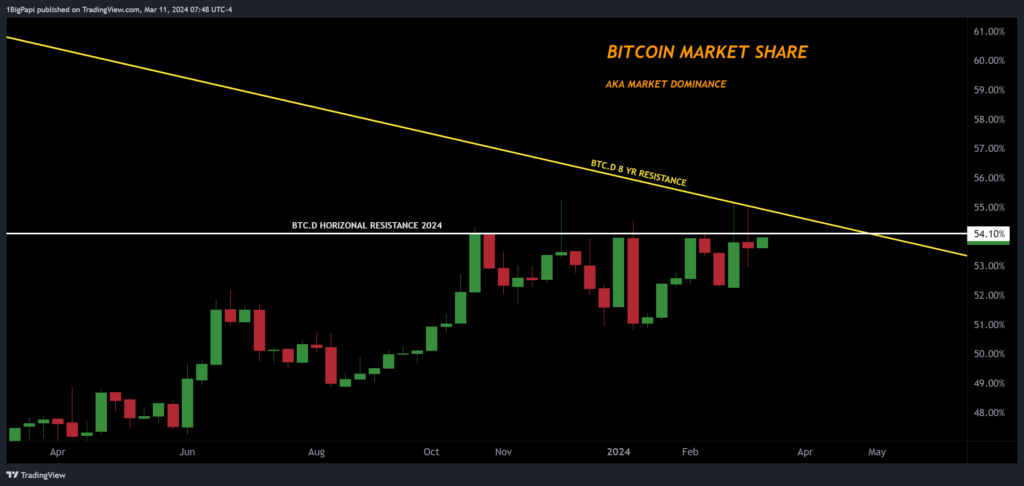
Bitcoin Dominance
Bitcoin dominance is another way of saying “Bitcoin market share,” or how much of the total crypto market is Bitcoin. Over time Bitcoin’s market share is trending down as altcoins and stablecoins grow in popularity. But on lower timeframes, you can also Bitcoin Dominance to guage when altcoin markets may rally. This is also described as an “alt season.”
For example, over the past week many of you probably saw news about memecoins and other altcoins rallying. Such rallies often follow a local or major top on Bitcoin dominance and can last for several weeks while Bitcoin consolidates for the next move.
On the chart below, note that Bitcoin is currently at major diagonal resistance, extending from 2016 and a local horizontal resistance. Since late 2023, Bitcoin remains stuck under 54%. Its possible it will break out later this year, but until then we see altcoin narratives starting to dominate the market.
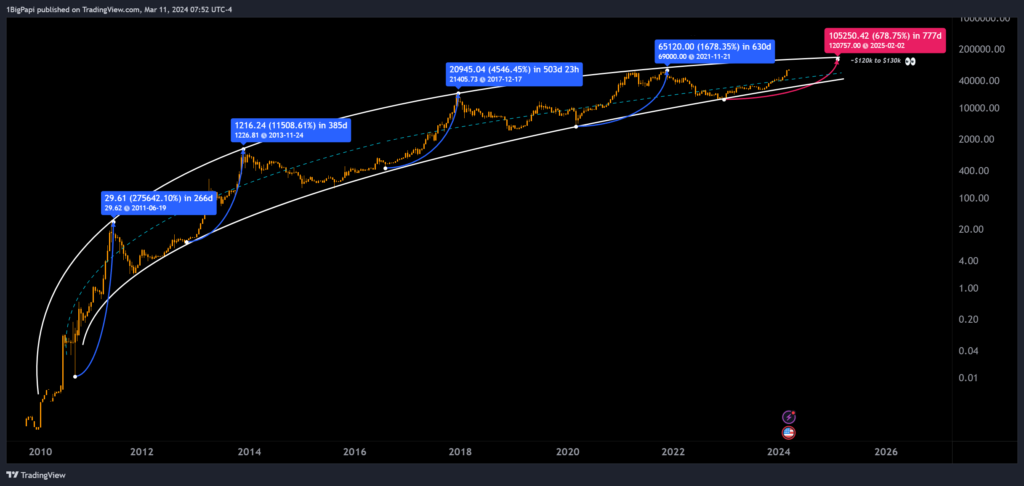
Long Term Cycle Forecast
When discussing cycle tops, you’ll get a range of answers. From this writer’s perspective, Q1 2025 between $100,000 and $130,000 are the most likely for cycle top. This aligns with historical trends.
But this also warrants some caution– this cycle is different due to institutional buyers and boomers entering the market. For that reason, be careful relying too much on earlier trends, and look for confluence with other data points. Its already apparent in several ways, like hitting new highs prior to the halving. We are in somewhat uncharted territory from now on.
On-Chain Data
Given that we are approaching price exploration in a new cycle, traders should begin evaluating different data that might suggest a minor or major top. Never take a singular indicator as gospel, and look for confluence across multiple data points. Below are a few popular ones.
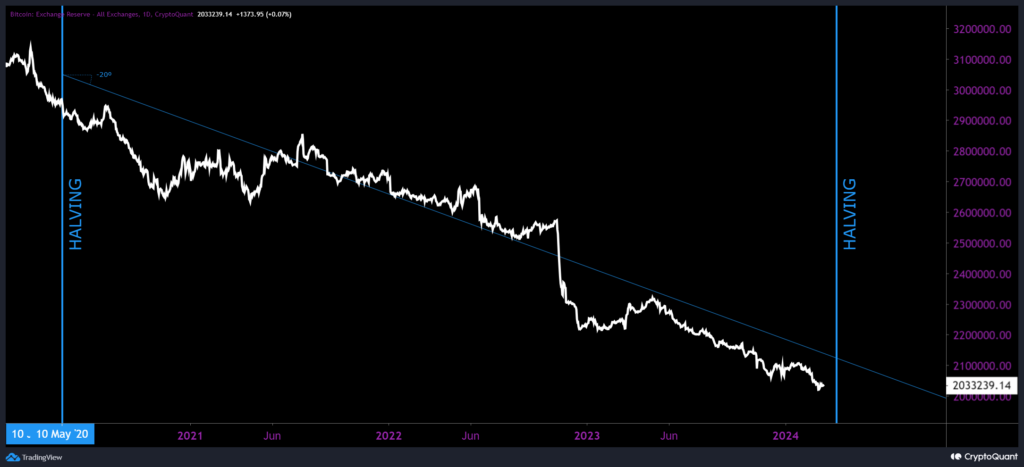
Supply of Bitcoin on Exchanges
One of my favorites is Bitcoin supply trends. On-chain analysts monitor the supply of Bitcoin on exchanges. Their assumption is that rising supply on exchanges is bearish, because it’s there to be sold. But this also brings us to an interesting point-
More Bitcoin is being bought and HODL’d than is being mined, and this has been the prevailing trend since 2020. As we know with commodities, scarcity boosts perceived value. With a 37% drain on total supply since 2020, we are trending towards scarcity faster than ever.
Towards the end of a cycle, you typically see heavy inflows of Bitcoin as whales average out of positions. The wildcard this cycle is how much ETF and increased demand from the general public will offset this typical end-of-cycle selloff.
While you consider your position for this cycle, its also a good time to consider your long term investment over the next decade, especially for leading cryptocurrencies like Bitcoin and Ethereum.
Bitcoin Supply on Exchanges Since 2020
Nearly 40% drop in 4 years, and accelerating via ETFs.
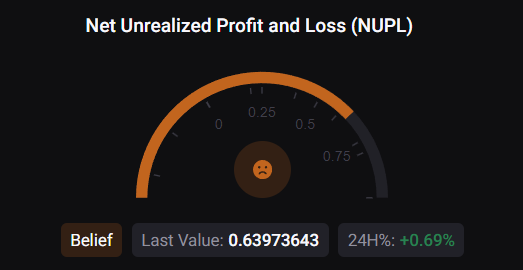
Net Unrealized Profit and Loss (NUPL)
NUPL indicates the total amount of profit/loss in all Bitcoins, represented as a ratio. You can see why that makes for a handy data point, because as more of the market is in-profit, the risk of a retracement rises.
Currently NUPL is trending in the “belief” range, where traders are holding and expect more upside.
NUPL indicates a potential minor or major top when it rises over 0.75. Another way to think of this is as a greed tracker. The higher the NUPL, the greedier the market is, and eventually greed will turn to fear, as profit-taking cascades towards the end of a cycle or subcycle.
Net Unrealized Profit and Loss
At ~.6 reflects increasing greed but room to run
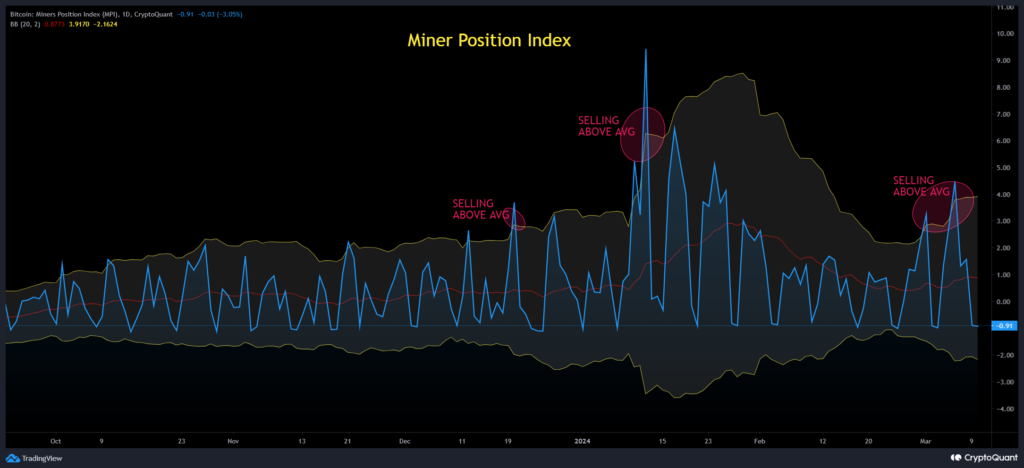
Miner Position Index (MPI)
Miners are among the smartest traders in crypto. For obvious reasons they need to optimize their selling to fund operations. Miners sell as little as possible during bear markets, and sell heavily in the early to middle bull market.
MPI is the ratio of miner selling against the yearly average. If its rising strongly above the average, it suggests miners are worried about a top approaching expedite their selling. They do not try to land the top of the market, so they often sell in advance, which is helpful to traders trying to also time their exits.
Miner Position Index
In the lower range of selling pressure past 90 days.
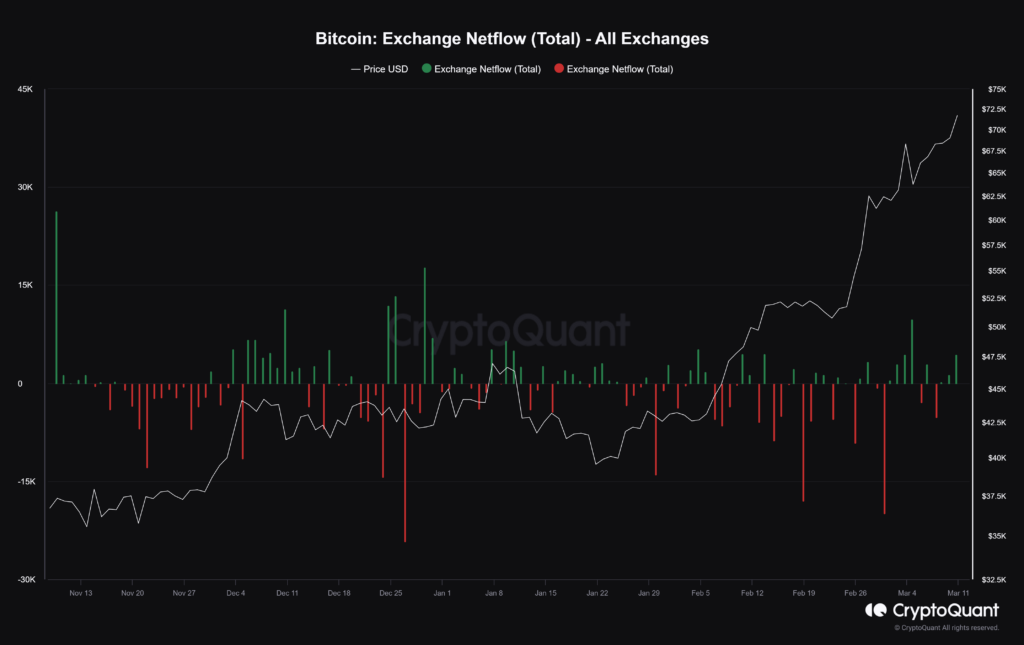
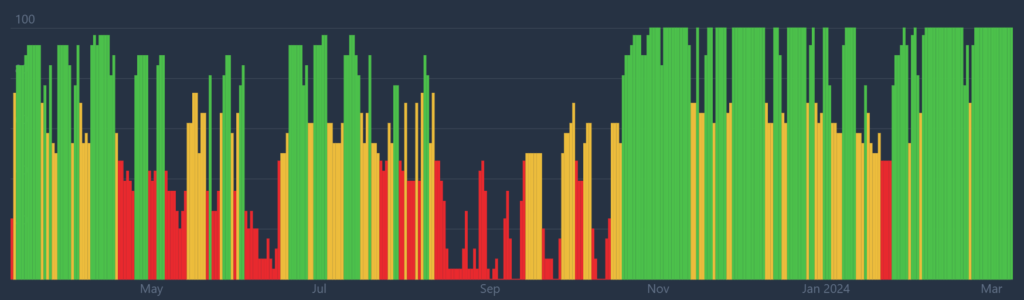
Bitcoin Netflow (All Exchanges)
Another fun data point is netflow. This shows the net result of a day’s inflows (moving Bitcoin to an exchange) and outflows (moving Bitcoin off an exchange).
The implication is that Bitcoin moved off exchanges is unlikely to sell. And as we approach tops, the netflows skew towards increasingly heavier inflows (moving to exchanges to sell).
Green on the chart below represents the inflow of Bitcoin to exchanges. Red is outflows, likely from someone buying Bitcoin and moving it to cold storage. Predominantly red or larger red bars represent a prevailing bullish sentiment in the market.
Exchange Netflows
Over the past 6 months are mostly outflows/buying.
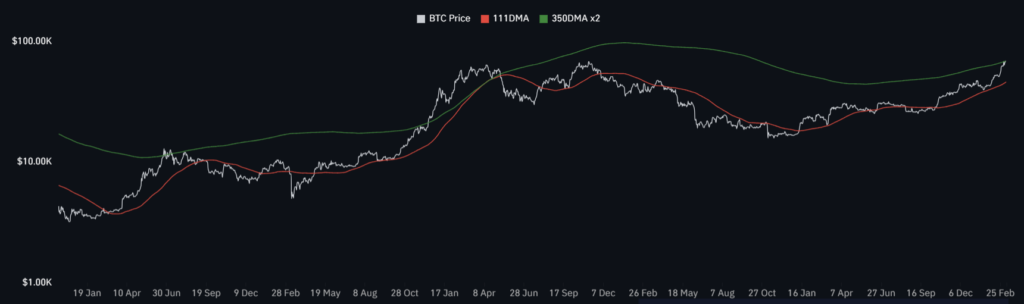
Pi Cycle Indicator
The Pi Cycle indicator is something many traders joke about, but there is no doubting it’s effectiveness.
It uses the crossing of two key moving averages (MA) to predict cycle tops: 111 DMA and 350DMA x2. It accurately called earlier cycle tops within a few days. The top signal is when the 111 DMA crosses above the 350 DMA x2.
Whether you believe these two MAs can predict cycle tops, its worth keeping an eye on it. As you can see, we still have time before the MAs converge.
Pi Cycle
Forecast a potential bearish cross Q4-24 to Q1-25
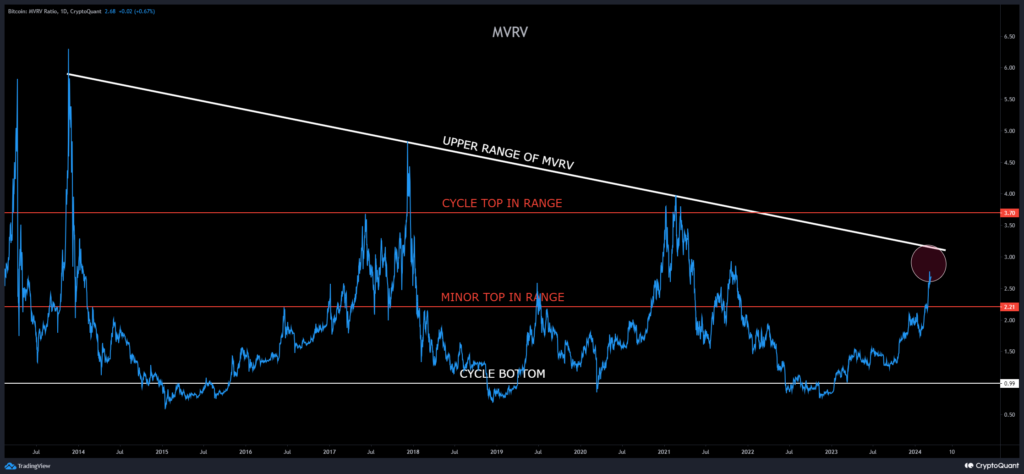
Market Cap to its Realized Cap (MVRV)
MVRV is used to understand when the exchange traded price is below “fair value” by looking at the ratio between market cap and realized cap (approximates the value paid for all coins in existence).
This gives an idea of whether the market is fairly priced and can be used to identify potential tops and bottoms in the market. As with any indicator, don’t use it in isolation; look for confluence with other data.
A new component this cycle is the orange line, the top of the MVRV range, which reflects an increasingly smaller ratio over time. For the first time this cycle, the longer term diagonal resistance is lower than the generally acccepted upper range of 3.7 for cycle tops, so traders should monitor both.
MVRV
Approaching 1st major resistance but room to run.
US Dollar Index (DXY)
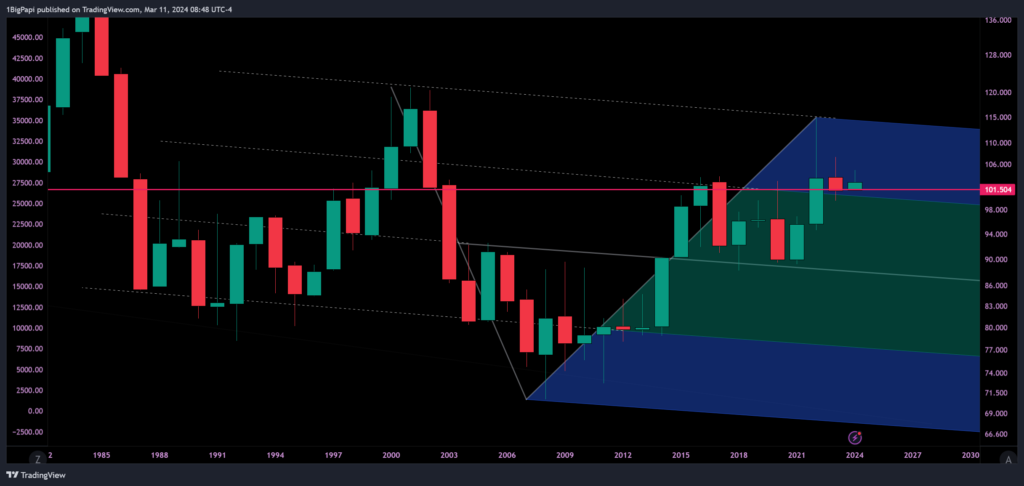
The US Dollar Index (DXY) is an index that measures the strength of the US Dollar. We’ve discussed the inverse relationship between the the DXY and speculative markets like crypto and equities. In general, when the DXY is up, crypto is down. The opposite is also true.
Of particular importance, the ~101 level, arguably the most significant for the DXY. Almost every time in the past 50 years, when DXY rejected from, or closed under the 101 range, it led to a prolonged period of weakening dollar.
If the fed drops rates in 2024, thats a strong signal that the DXY will continue to drop. Some early expectations of rate cuts are appearing in the DXY, as it dropped a little over 2% in the past few weeks.
Market Sentiment
Economic events, political discourse, or general price action are all events that can impact sentiment. The market is currently overwhelmingly bullish, and has been since October 2023.
This is a reflection of increasingly positive sentiment around cryptocurrencies. Various factors can affect sentiment, which in turn can lead to a selloff.
Going into the election cycle, we can expect some volatility to accompany the crypto narrative, with players like Senator Warren building an anti-crypto coalition. It remains to be seen if this will have a bigger impact on sentiment than the increasingly accomodating macro.
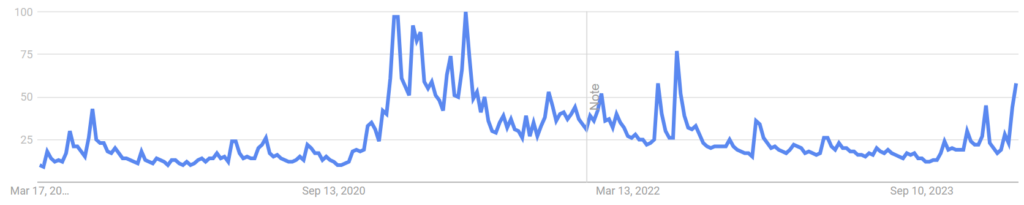
Other Sentiment Data
Coinbase App Ranking: Historically when Coinbase rises to the top of the app charts, a major top is approaching. Currently 155 globally, 11 among finance apps
Google Trends: Google Trends reflect what people are searching for on Google and also present a clear sentiment indicator when they rise towards 100. Currently Bitcoin is trending at it’s third highest in five years.
Note: Remember Bitcoin, Ethereum, cryptocurrency is apolitical; its designed by and for the people. Governments, banks, funds, they are tourists here.
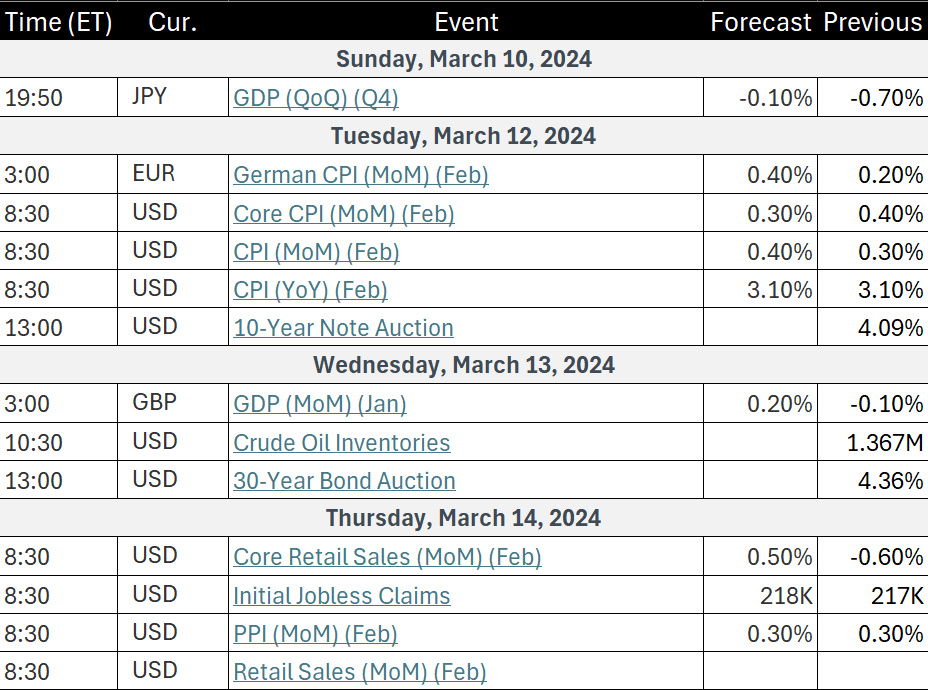
Crypto & Economic Calendar
Disclaimer: Nothing found on this website, or any sources linked to this website includes financial advice of any sort. We are not certified financial advisors, use our content at your discretion as entertainment, and as an educational resource. Do your own research.
The events below inform governments, corporations, traders and investors on the health of the economy. I only list events noted as “high volatility expected” in related markets.
——————————————————————————-
If you enjoyed this article and want more hot takes and interesting posts about the economy, web3, crypto, decentralized finance, NFTS and more – follow Papi on Twitter/X at https://twitter.com/1MrPapi.