
There is considerable speculation about Mt. Gox Bitcoin flows and the associated market pressures. Combined with miner activity, Germany’s selling, and prevailing negative sentiment, the Mt. Gox BTC will test the market’s capacity to absorb BTC throughout Q3.
It’s too early to predict the exact impact of Mt. Gox BTC on the market. We will need to observe the percentage of holders selling their BTC in the coming weeks to build a more accurate forecast.
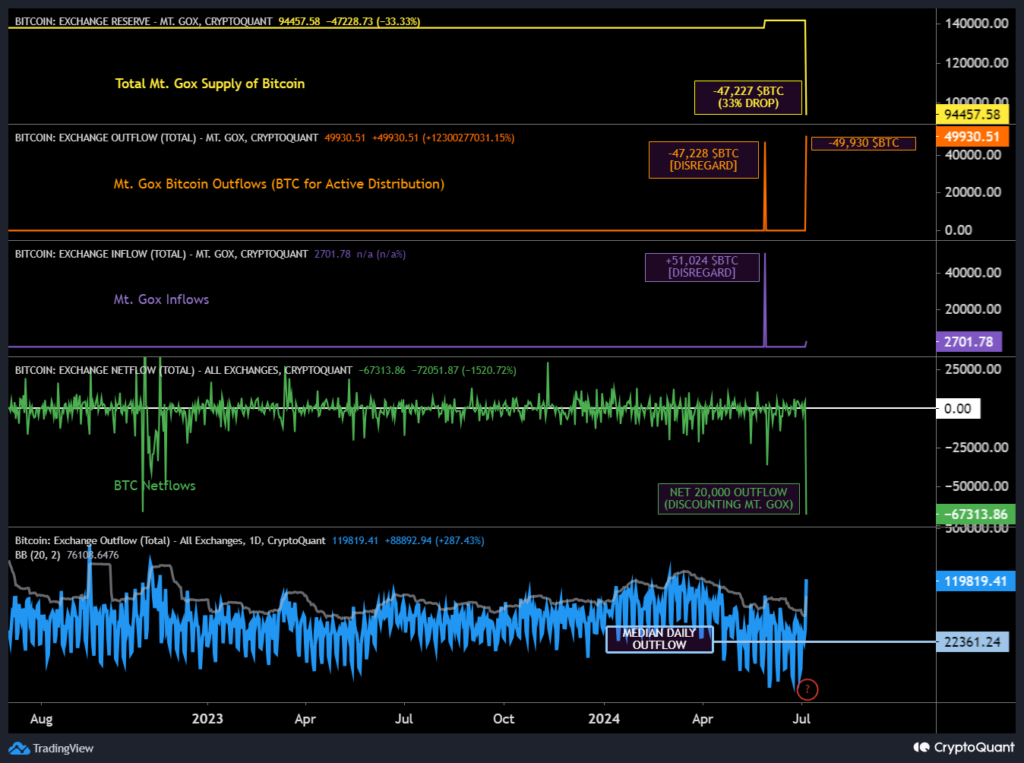
For that purpose, I assembled an series of charts that cover key metrics related to Mt. Gox flows, supply, and the ability of markets to absorb potential selling:
- Total Supply of Mt. Gox BTC: Approximately 33% of the total supply (~47,000 BTC) has already been set aside for distribution.
- Mt. Gox BTC Outflows: Logs BTC leaving Mt. Gox holdings, indicating preparation for distribution.
- Mt. Gox BTC Inflows: Tracks any inflows to Mt. Gox reserves, which is rare but possible. This one is mostly for me, to keep the math accurate.
- BTC Netflows: The net result of daily inflows (implied selling) and outflows (implied buying), a crucial metric indicating market absorption capacity. Recently, there’s been an average net positive flow of around 150 BTC daily, indicating a weakly bearish trend with more BTC coming in than leaving exchanges.
- BTC Total Daily Outflow: Raw outflow numbers suggest implied buying pressure. This has been trending towards bear market levels, correlating with bearish sentiment driven by Mt. Gox, Germany, and other uncertainties.
Final Thoughts:
Netflows currently suggest an inability to absorb significant BTC inflows. If large-scale deposits occur from Germany or Mt. Gox BTC holders, prices could drop into the $40,000 range or even the upper $30,000s in a worst-case scenario.
Looking purely at numbers, the market can’t absorb significant more BTC inflows, but small sales, say a few hundred more a day, won’t have a significant impact on price. OTC deals could also influence the trend.
Improvements in macroeconomic sentiment, such as recent promising US inflation data, or the upcoming Ethereum ETFs, could improve market sentiment and the capacity to absorb more BTC selling, suggesting a potentially bullish Q4-24.
You can follow this chart in real-time, but you need an account on CryptoQuant (unfortunately they paywall access to this feature and I can’t reproduce it on TradingView).
Link: https://cryptoquant.com/prochart/iUDBX494THDSxGT