
Cryptocurrency markets are in their infancy relative to other asset classes. They have more potential for price appreciation (or depreciation) but this makes long term predictive analysis challenging and interesting. We will explore seven data points and long term Bitcoin and cryptocurrency trends, and share some predictions for the next cycle.
Note from author: this is a lengthier analysis. If you want to scan the article for the highlights, look for the summary in each section and at the end of the article.
Crypto Market Cycle Overview

Before we dive into predictions, lets discuss market cycles. There are four main phases of a market cycle: accumulation, markup, distribution and decline:
1) Accumulation phase: This is when smart money (institutional investors, whales, etc.) is buying up the asset for long-term holding. Prices are generally low during this phase as there is little buying pressure from retail investors.
2) Markup phase: This is when the price begins to increase as more investors enter the market. FOMO (fear of missing out) kicks in and drives prices higher.
3) Distribution phase: This is when smart money begins to sell off their holdings. Prices peak during this phase and start to decline as selling pressure increases.
4) Decline phase: This is when prices continue to fall as more investors exit the market. This is typically the most volatile phase of the cycle.
Recently we saw 2021 as a distribution phase, where smart money exited positions. This accelerated into a decline phase into 2022, as the U.S. Federal Reserve announced and began hiking interest rates. Investors typically interpret that as a signal to exit risk assets, like cryptocurrency.
The decline accelerated through 2022, with crypto markets hit harder due to the insolvency and bankruptcy of leading projects and exchanges. The optimist view is that the worst part of the decline phase is behind us as we begin 2023; the implosion of the FTX exchange was a final stress test for the market and it appears we are beginning to emerge from the fallout of that event.
Long Term Market Trends & Predictions
In the following sections we review long term Bitcoin and cryptocurrency trends. As a tradable asset, Bitcoin is barely thirteen years old and most of that in a stable macroeconomic climate. The rest of the crypto market is even younger. Recent instability in global markets, record inflation, and the war in Ukraine add additional complexity to any predictions.
Analysis is an attempt to be objectively predictive, but even the best economists and analysts won’t get it right every time. That said – it is fun to explore possibilities and that is what we are doing – simply exploring possibilities for the next cycle.
Momentum Cycles
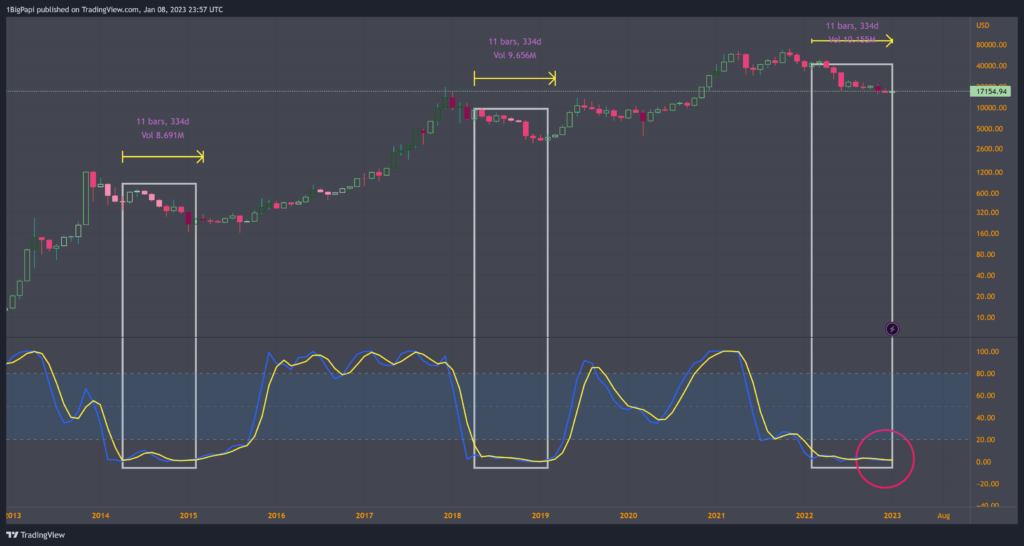
Observing Bitcoin’s momentum cycles we find a consistent pattern that suggests a floor is here or in this range. Of course we will continue monitoring the central banks to see how they respond to the macro outlook. As a risk asset, crypto trades inverse to central banks and safe assets like the U.S. Dollar.
We measured momentum cycles using the Relative Strength Index (RSI) indicator. It measures the speed and magnitude of crypto’s price changes to determine whether an asset is overvalued or undervalued. The lower numbers reflect an oversold state, and based on historical momentum patterns at the bottom of a bear market, we can forecast a possibility for this cycle – which suggests an impending breakout as we exit this bearish momentum cycle.
Summary: In previous bear markets Bitcoin took ~11 months to reach the momentum floor [RSI between 0 and 3]. The 330 day counter for this cycle ends between January and February 2023 (reference the third box in the chart above). In the current uncertain macro climate, we may require additional time to log a proper recovery. View January into February as the earliest point for it to begin a pivot to the upside.
Bitcoin Adjusted for the M2 Money Supply

Excessive money printing in recent years has many impacts, to include skewing technical data. Printing money inflates supply and dilutes the value of the fiat currency, in this case the U.S. Dollar. Because we generally measure the value of Bitcoin in US Dollars, this makes it more difficult to fairly chart the value of Bitcoin.
In the chart above, you’ll find that when one adjusts the Bitcoin | U.S. Dollar chart for the M2 money supply (formula: BTCUSD/FRED:M2SL*21), there is a picture perfect correlation between the 2019 cycle, and the current cycle.
- The COVID Black Swan low for Bitcoin aligns to the 2019 low
- The 2022/23 low aligns with the 2019 top
Summary: Some analysts are eyeing another possible drop to the lower teens (estimated 30% drop to the next lower support level), which aligns with some historical trends. However the confluence of other data points we reviewed give a measure of confidence that we are at or close to the bear market floor and the 2019 levels will act as support. This analyst suggests this range as a healthy Dollar Cost Average (DCA) entry with the upside potential much greater than the downside.
Cycle Duration
Bitcoin leads the cryptocurrency market cycle due to being the first, most liquid and most trusted cryptocurrency. Many investors use the halving of Bitcoin to mark the start of a new cycle. Halvings are an adjustment to the rewards miners receive for mining Bitcoin. It had a profound impact in earlier cycles, but over time that impact diminishes. Because it doesn’t always correlate to price action, we will start this by measuring cycles based on cycle high price and low price.
In general Bitcoin and crypto cycles grow longer over time. In the earliest cycle we reached the decline phase within a year’s time. This was a highly speculative, low liquidity cycle. Bitcoin was still unproven and not well known.
By the second and third cycles we see cryptocurrency emerging as a known asset class, and market cycles settling between three and four years to complete. This is where we see more correlation with the halvening cycles manifest. However this is also during a relatively stable macroeconomic period with little else to impact cryptocurrency market cycles.
The end of the fourth cycle and start of the fifth is not yet confirmed. The fourth cycle through COVID-19 pandemic was seemingly accelerated due to government intervention and the injection of billions of dollars into markets. It is the first cycle to potentially post a shorter cycle than it’s predecessor.
Summary: Despite the external factors, we see a potential trend emerging where the duration of a cycle relatively to the last sees a drawdown of around 50%. This suggests the most likely scenario, we see the next cycle high by summer of 2025.
Cycle Strength

As an emerging asset class, cryptocurrency markets will log diminished gains and lower volatility over time. For a general assessment of Bitcoin’s lifetime trends, a series of logarithmic trendlines work best, and can aid you identifying the upper and lower ranges of Bitcoin cycles.
As shown in the chart above, we can measure the strength of individual growth cycles using trend angles, the higher the angle the greater the velocity in price appreciation.
We observed an extreme rise in value early in Bitcoin’s lifecycle, nearly a 70° uptrend. Very nice for those early believers. The uptrend begins to cool off after 2019, and diminished gains manifest.
Each cycle reports a consistent reduction in growth of around 50% from the preceding high. If that trend continues, the next cycle high will follow an estimated 3.5 degree uptrend for approximately 1,300 days, notably weaker than the 7° uptrend of the last cycle, and far less than the 65° uptrend of the first cycle.
Summary: With the next high estimated in May of 2025, that would place Bitcoin at around $120,000. However even in the bullish environment of 2021, Bitcoin only reached around $70,000. It needs a catalyst to achieve 6x growth in market cap over the next 2 years. With crypto-specific regulation on the horizon, it will take very accommodating policies to trigger enough adoption to drive that level of growth.
Many are looking at the wealth accumulated by the boomer generation, and their children, which is the majority of wealth globally, and largely not invested in crypto.
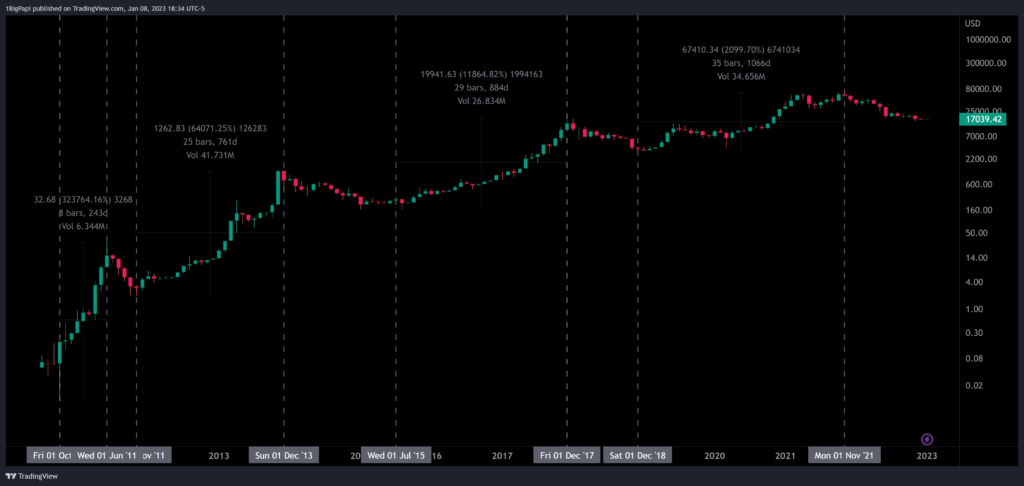
Growth from High to High
Measuring growth between cycle highs using basic % gains from one high to the next is an imperfect science. As a singular data point, it doesn’t account for external factors like growing adoption, central bank actions, size of investments, regulatory climate or money supply.
Nonetheless we clearly observe a reduction in growth between cycle highs over time, from over 3,000% growth in cycle two, to only 235% growth by cycle four. This supports the thesis that as an asset class, Bitcoin is maturing. Mature assets don’t typically report 3,000% gains in only a few years.
Summary: Using the average reduction in growth over Bitcoin’s lifecycle, we forecast a 179% growth from 2021’s top, leading us to $115,000 as the next cycle’s high.
Diminished Returns

“Diminished Returns” is another way of saying that each cycle’s new investors earn less than the investors from earlier cycles. Each cycle grows less than the last. This trend appears to be pitting the growing cost of entry against the growing adoption. Bitcoin’s approach a range where it’s growth significantly slows; it is likely that nothing less than mass adoption will see it reverse that trend.
Measuring diminished returns using the bear market low compared to the next all-time high: Bitcoin delivers a very consistent 81% to 83% reduction in growth each cycle. This is one of the highest confidence trends in Bitcoin’s lifecycle.
That suggests the next cycle high will also be the first high to not log a new all-time high, with an 82% reduction landing it around $57,000.
Other analysis in the diminished returns space suggests that increased competition from leading altcoins, like Ethereum, might disrupt Bitcoin’s growth trajectory and drive growth down further, into the $30,000 to $40,000 range. This is possible but hard to qualify, especially in light of a rapidly evolving regulatory space that may benefit Bitcoin over most altcoins.
Summary: Because this isn’t measuring a trend based on time, this author suspects the forecasted $30,000 to $50,000 range will act as resistance through 2023, into 2024 and until a supportive regulatory climate is codified by U.S., European and Asian markets enabling crypto to rise above previous highs. That would align with other analysis above, which supports a new high in 2025 (potentially in late 2024).
Macroeconomic and Geopolitical Outlook
Historical cryptocurrency market trends are secondary to the current macro outlook. Generationally high inflation, money printing, volatile energy markets, war between Russia and Ukraine – these are impacting global economies and markets.
In response to the COVID pandemic, The US Government expanded its balance sheet by trillions starting in 2020. It led to extreme retail investor bullishness, speculation and mania, and the emergence of memecoin traders, short squeezes on stocks like GameStop, and other events that might never have happened otherwise. To bring markets back to a healthy state, they effectively have to reverse that trend, and thats what led to the 2022>2023 bear market we remain in.
Macroeconomic issues weigh on retail investors, who generally abandon risk assets to hold cash, or invest in gold. Despite the promise of being an inflation hedge, or hedge against fiat’s failures, Bitcoin has not yet achieved that status on smaller timeframes.
Unfortunately even more people are unable to invest at all, and struggle to pay bills in the current economic climate. These real world issues need to be addressed before we see speculative markets rise again, and with this being crypto’s first macro bear climate and recession, we have no historical data to draw on.

Summary: The assumption is that crypto will largely track equities and struggle until the Fed begins to relax interest rates and the US Dollar Index (DXY) retraces. Keep in mind that these economic stressors, when combined with sometimes mismanagement at crypto companies like FTX or Luna Foundation, can lead to significant sell events.
Our assumption is that FTX was the worst this cycle will see in terms of a large crypto player imploding, but these systemic risks can invalidate a lot of technical trends and one you should be aware of.
Summary
These are simple projections, based on trends that existed prior to the current depressed macroeconomic outlook. None of these should be used to make investment decisions. They are meant to provide a baseline knowledge of historical trends.
In the coming year(s) the macro and geopolitical climate will likely drive down growth metrics for risk assets, and upcoming regulation from the U.S. Government, Euro Zone and other economic powerhouses may further erode historical trends.
However the impact of regulations isn’t only negative. It may provide support and clarity to the space, boosting crypto investment and lift markets.
Looking at the trends we reviewed above, Bitcoin targets in the lower $100,000 range appear most likely for the next all-time high. However the $100,000 target is only possible if the market can overcome the very consistent trend of diminished returns, which would prevent Bitcoin from surpassing $60,000 in the next cycle. In the meantime targets between $30,000 and $50,000 feel justified as an interim or mid-cycle target, especially against slower and diminished returns.
This is all very uncertain, but what is certain is that the next Bitcoin cycle will be unlike any other in history. Regulations, macroeconomics and geopolitics have never been so intertwined with the development of a new asset class. It is an exciting time to be involved in cryptocurrency.
About the Author: Mr. Papi is an analyst, writer, podcaster and general fan of all things crypto and web3. If you enjoyed this, or if you have feedback, ideas or something to discuss – you can visit and follow him on Twitter at this link. You can view his analysis on CryptoQuant at this link.