VWAP is one of the main tools I use to find levels to trade — it stands for Volume Weighted Average Price. I haven’t personally seen too many people use it, so that’s the reason why I’m explaining it here (focused on my own practices).
Definition
First and foremost, it’s an average price, as its name says. But instead of being a simple average, it’s a weighted average. This means candles with more volume impact more on the measurement than the ones with less.
Based on this, you could say it’s an improved MA that takes into account volume.
To specify even more, below is the formula used, which reiterates what I just said. Do also note that the calculations are cumulative (ie. from where they are anchored until the present).

How I use it
I’d say around 95% of the time I’ve ever used it has been anchored to highs/lows. Below is an SPX chart in which you can see rejections/slight deviations from these VWAPs anchored to key reversal points.
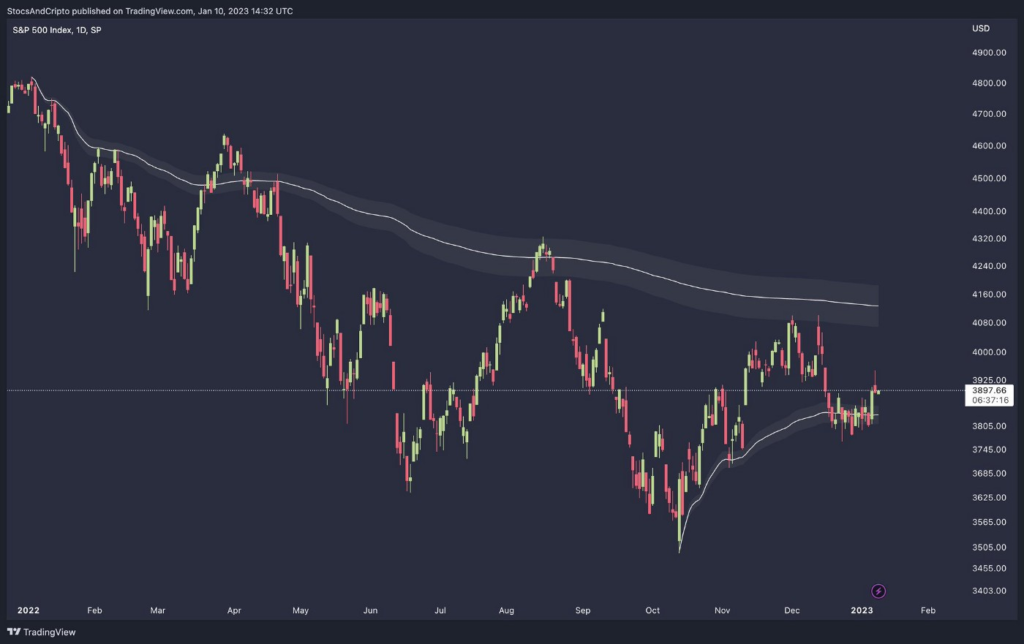
I also slightly changed the settings so the indicator itself is more accurate:
- Source of the calculations. When anchoring to a high, choose ‘high’; and when anchoring to a low, ‘low’.
- 0.2 standard deviation (STD). Useful to give the VWAP a bit of wiggle room. This is just visual, as I’m not keen on entering before the VWAP is hit — I usually have it turned off.
Rules
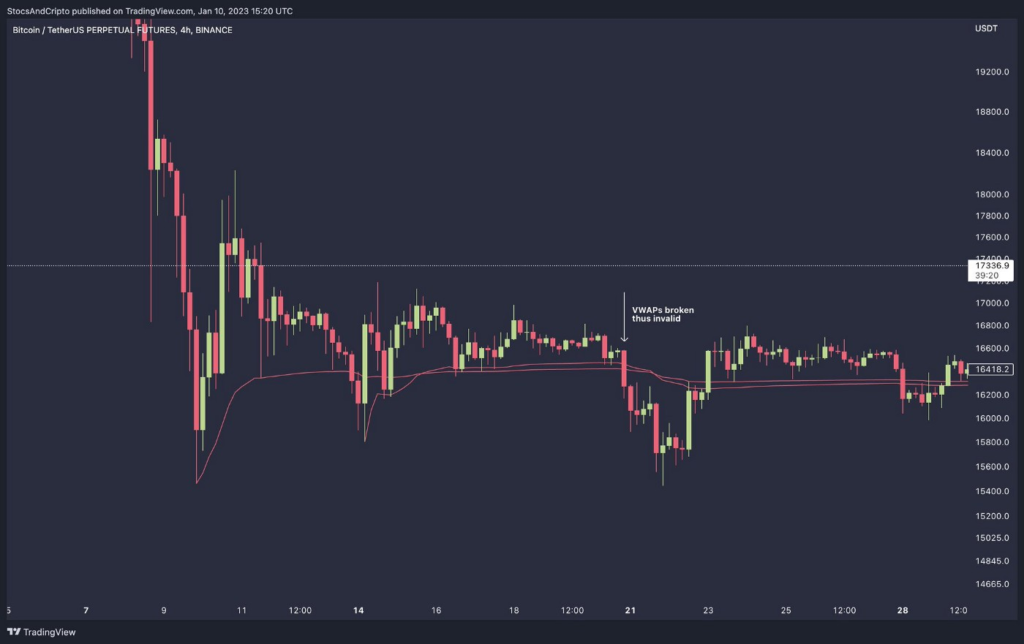
- You can’t anchor it to every high/low and expect it to be always respected. This is an example of a poor anchor, which breaks after the 1st/2nd test.
- They work best when there’s a clear trend in which price trades well above/below and the retrace to VWAP would be considerable.
- The further away the first test is, the more tradable it becomes (it can be way more pronounced than in the example below).
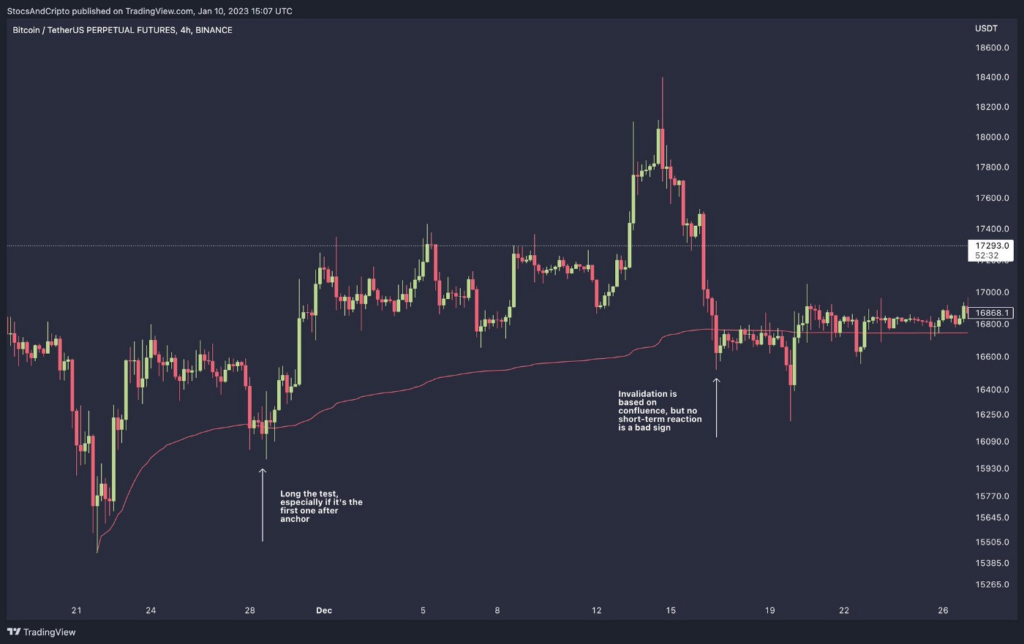
- The more immediate the reaction the better. Having a mental stop is advantageous, but it also needs discipline.
- Use VWAP tests only as ENTRY. You can’t expect price to retrace back and trade in anticipation.
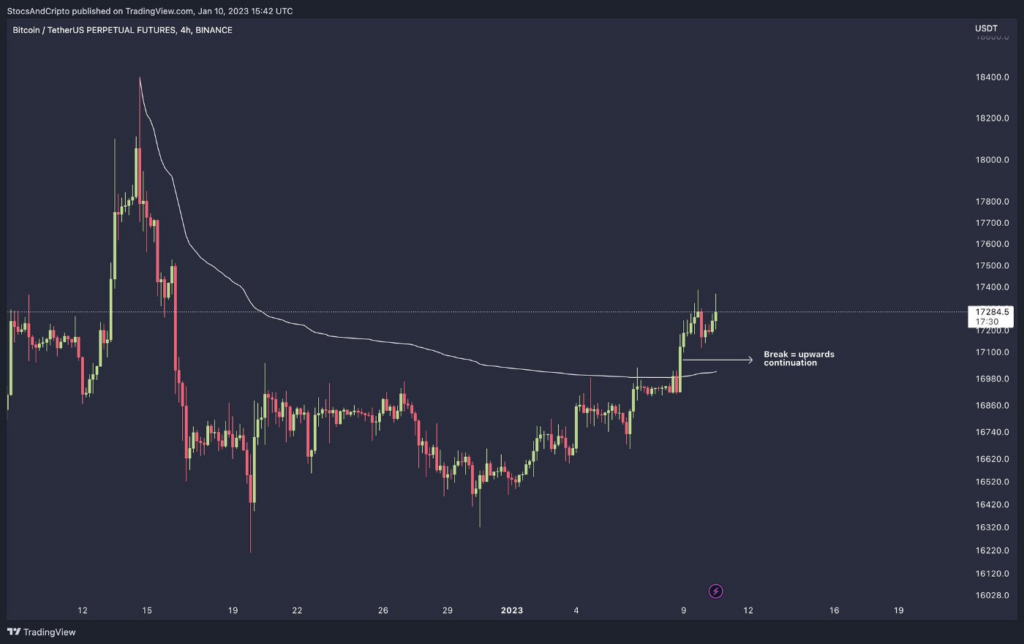
- I trade nothing near to 100% of the retests, instead I watch out and use breaks to define trend direction (see chart below).
- Confluence is always superior. I always say it and will keep always saying it.
- And final tip, BTC/ETH/indices give better results than alts due to better liquidity.
Confluence
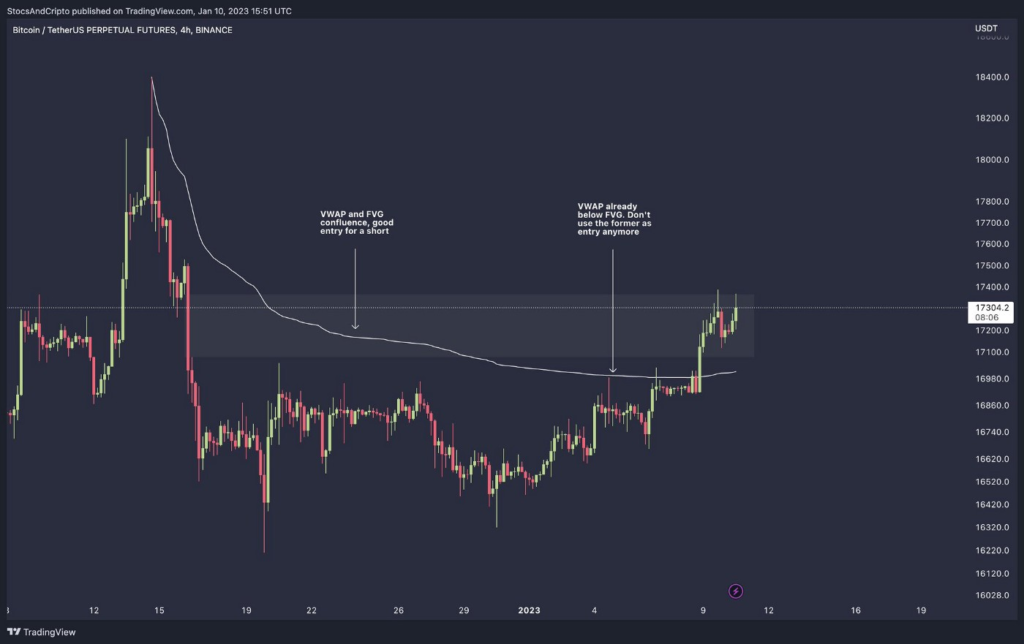
About confluence, there’s one that I always prefer: FVGs, or just session gaps in stocks (shortly said, FVGs are a price area where there are no wicks). Rules for confluence are written on the chart and these are set in stone.
For example, in the chart above, I could see something like this happen — consolidation at these prices, then $16.7k retest and then more ranging, eventually a last leg up towards $19k (less likelihood)
Final thoughts
And finally, for other examples of how I’ve used anchored VWAP to highs and lows, you can check this older Twitter thread:
(You can also use it anchored to sessions — especially for SPX — but I’m still experimenting with this so I don’t have the confidence to say too much about it.)