
What is Market Profile Trading?
Market Profile trading is a sophisticated tool used by traders to analyze market behaviour and make informed decisions. One of the key concepts within this framework is TPO, which stands for Time-Percentage-Opportunity. Understanding TPO can significantly enhance a trader’s ability to interpret market data and predict future price movements. In this blog post, we’ll delve into the details of what TPO is, how it works, and why it’s crucial for effective market analysis.
What is TPO?
TPO stands for Time-Price-Opportunity. It is a statistical charting technique used in Market Profile to represent the amount of time a market spends at a particular price level. Each TPO is typically represented by a letter or a block on a Market Profile chart, and it indicates that the market traded at that specific price during a given time period.
Breaking Down TPO:
Time: The time component of TPO indicates the specific time periods during which trades occur at various price levels. In traditional Market Profile charts, each trading day is divided into 30-minute intervals, and a unique letter or block is assigned to each interval. This way, traders can see which price levels were active during different times of the trading day.
Price: The price component represents the price levels at which trades occurred. The y-axis of a Market Profile chart shows price levels, while the x-axis shows time. The combination of these two axes helps traders visualize where the majority of trading activity took place.
Opportunity: The opportunity aspect refers to the likelihood or potential for trades to occur at specific price levels. Areas, where the market spends more time (i.e., where more TPOs accumulate), are considered areas of high opportunity. These price levels are often seen as significant support or resistance levels because they reflect where buyers and sellers find the most value.
Why TPO Matters:
Identifying Value Areas: TPO helps traders identify value areas, which are price ranges where a large amount of trading activity occurs. These areas indicate where the market perceives fair value and are often used to predict future price movements.
Support and Resistance Levels: By highlighting price levels with significant trading activity, TPO charts help traders identify potential support and resistance levels. These levels are crucial for making informed trading decisions, such as setting entry and exit points.
Market Sentiment: The distribution of TPOs on a Market Profile chart provides insights into market sentiment. For example, a cluster of TPOs at higher price levels may indicate bullish sentiment, while a cluster at lower levels may indicate bearish sentiment.
Trend Analysis: TPO charts can also be used to analyze market trends. By observing the shifting of TPO clusters over time, traders can gain insights into the direction and strength of market trends.
How to Use TPO in Trading:
Create a TPO Chart: Use trading software that supports Market Profile charts to create a TPO chart for your chosen market such as ExoCharts.
Identify Value Areas: Look for clusters of TPOs to identify value areas. These areas often act as support and resistance levels.
Analyse Trends: Observe the distribution of TPOs over time to identify market trends and shifts in sentiment.
Make Informed Decisions: Use the information from your TPO analysis to make informed trading decisions. Set entry and exit points based on identified support and resistance levels, and adjust your strategy according to market trends.
Conclusion:
TPO (Time-Price-Opportunity) is a powerful tool in Market Profile trading that helps traders analyze market behaviour and make informed decisions. By understanding and utilizing TPO, traders can gain valuable insights into market sentiment, identify key support and resistance levels, and effectively analyze trends. Incorporating TPO into your trading strategy can enhance your ability to navigate the markets and improve your overall trading performance.
Whether you’re a seasoned trader or new to Market Profile, mastering TPO can provide you with a significant edge in the markets. Start integrating TPO analysis into your trading routine and experience the benefits of this robust analytical tool.
TPO Example (Daily TPO Market Profile):
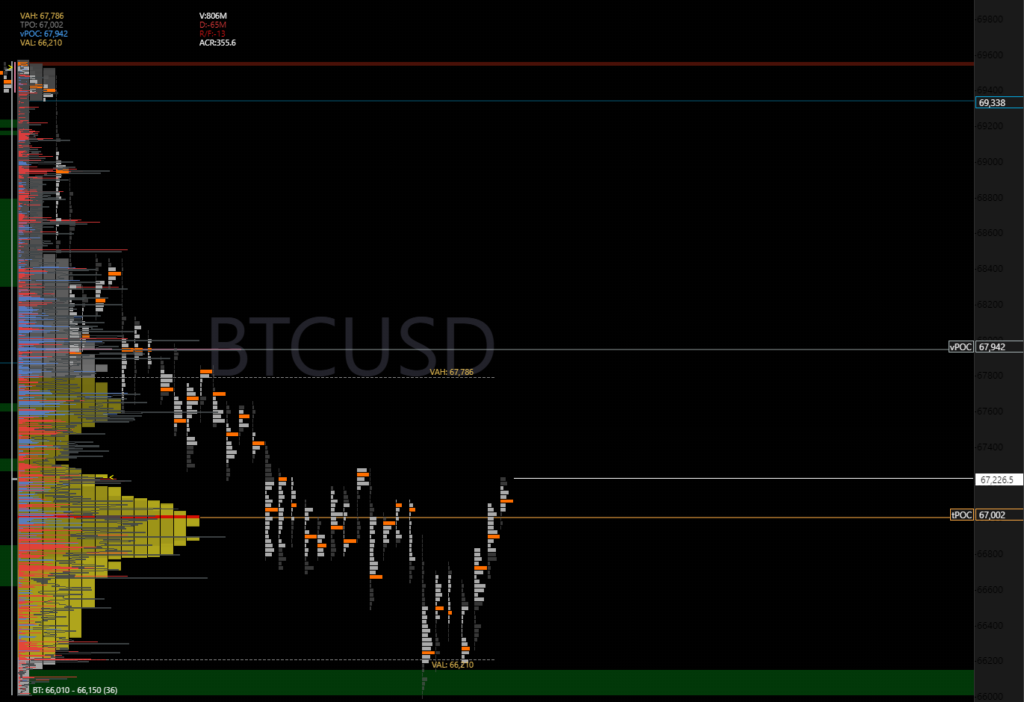
The above is a “Daily TPO” chart for BTC:USD on Bybit. It represents Bitcoin’s price movements against the US Dollar (USD) over a specific period. This chart utilises the Time-Price-Opportunity (TPO) method to provide a detailed analysis of market behaviour. Let’s break down the various components of this chart to understand how to read and interpret it effectively.
Key Components:
Volume Profile:
- The left side of the chart displays a volume profile, showing the distribution of traded volume across different price levels.
- The coloured bars represent the volume of trades at each price level, with yellow areas indicating high-volume zones and green/red areas indicating lower-volume zones.
Price Levels:
- The y-axis of the chart represents the price levels of BTCUSD, ranging from approximately 66,000 to 69,000.
- Key price levels are marked, such as VAH (Value Area High), VPOC (Volume Point of Control), VAL (Value Area Low), and IPOC (Initial Point of Control).
TPO Clusters:
- The chart uses letters or blocks to represent TPOs, indicating the price levels where trading activity occurred during specific time intervals.
- These TPO clusters help identify where the market spent the most time, indicating areas of high activity and potential support/resistance levels.
Value Area:
- The value area represents the range where 70% of the trading activity occurred.
- VAH (Value Area High) at 67,766, VAL (Value Area Low) at 66,210, and the VPOC (Volume Point of Control) at 67,942 indicate significant price levels within this range.
Trading Insights:
- The TPO chart helps identify areas of high and low trading activity, providing insights into market sentiment.
- High-volume areas (HVNs) indicate strong support or resistance levels, while low-volume areas (LVNs) may suggest potential breakout points.
How to use the Daily TPO Chart:
- Identify Value Areas:
- Use the value area (between VAH and VAL) to understand where the majority of trading activity occurred. This can help you identify potential support and resistance levels.
- Observe TPO Clusters:
- Look at the distribution of TPO clusters to see where the market spent the most time. These areas are crucial for determining market sentiment and potential future price movements.
- Analyze Trends:
- By examining the shifts in TPO clusters and volume profile over time, you can identify trends and changes in market behaviour.
- Make Informed Decisions:
- Use the information from the TPO chart to set entry and exit points for trades. Pay attention to the VPOC as it often acts as a magnet for price action.
Understanding and utilizing the Daily TPO chart can significantly enhance your trading strategy by providing a clear view of market dynamics and potential price levels to watch.
Example:
Below is an example of an analysis done by myself using TPO in addition to various forms of t/a on TradingView.