
Bitcoin – Current Trend
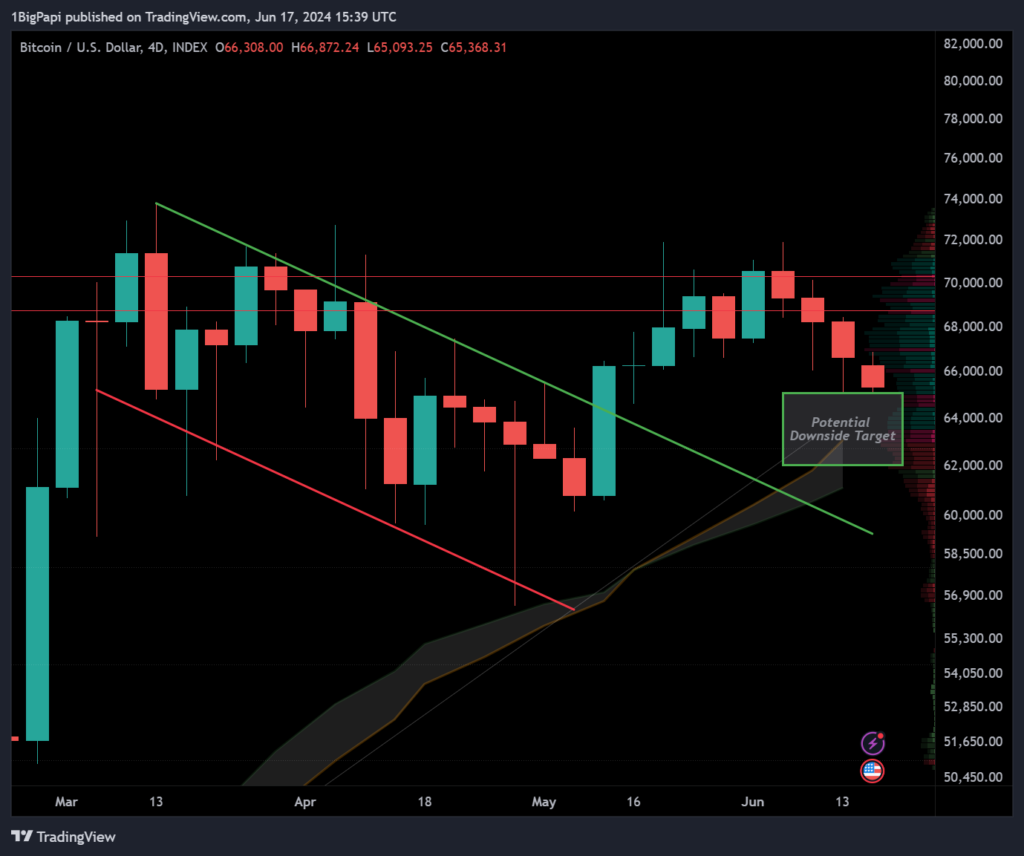
Near term forecast: Last week we called a minor breakout with potential bullish and bearish targets depending on mid week’s macro volatility. Since then we landed on the top of my downside breakout target. That doesn’t mean it can’t go lower (like $60k to 62k), but sometimes these moves get front-run and I see a lot of support along that $65.1k range.
This isn’t the major breakout (yet), and just continued consolidation and indecisive chop like we’ve seen since March. That said, momentum is coiling for a proper breakout in the next quarter. I’m not keen on putting a timeline to things, but markets will try to anticipate a Fed pivot and that means we may see upside continuation as early as this summer, and as late as September/October. I think odds are unlikely that it goes later than that, especially with elections in November.

Two most likely scenarios for the remainder of 2024:
- 1.) On the back of ETF approvals for Bitcoin and Ethereum in the US (and Hong Kong), accelerate this crypto cycle, leading to a rally beginning as early as this quarter, and a cycle peak late 2024, possibly around US elections in November.
- 2.) We continue sideways summer without any sustained breakout. This aligns with historic trends and timelines for diminished returns and lengthened cycles. Later in Q3 the odds of a Fed pivot increase and risk assets begin to rally. Cycle peaks between Q4 2023 and H1 2025
Of course neither is a guarantee, but those are the two scenarios I consider most likely. If the data changes and suggests a different outcome as more likely, we adapt our investing strategy.
Bull Case: Historically the ~10 months post-halving grow increasingly bullish; Bitcoin ETF flows rising again; Ethereum ETF approved; latest FOMC reinforced easing bias, Coinbase app isn’t near the top of app ranking but elevated. On-chain data isn’t yet peaked but elevated as in early to mid bull markets. Democrats are pivoting on their former anti-crypto hardline stance, and its become an election issue now that Trump has fully endorsed it.
Bear Case: The US Fed may not taper rates as early as markets anticipate due to uncertain macro, the US election could introduce divisive political and regulatory dialogue around cryptocurrency; geopolitical tensions in the Middle East and Ukraine, global macro is unstable (example: Japan); and politicians’ endorsement of crypto is not a guarantee of long term support.
What you do from here depends on your risk appetite, and won’t change until we leave this range:
- If you are still buying spot (as I am), use this time to rotate out weak performers, and double-down on strong performers. Don’t ape and lose it all on memecoin rugs. Be aware of tax implications as you do this and set aside some stables or cash for that. I use Coinbase to schedule weekly buys, its super simple.
- If you are a LOW RISK spot holder, you should already be exiting positions. Sell and don’t look back, or FOMO might pull you back in. Remember tax implications when selling, which makes it risky to re-enter the market after exiting.
- If you are a day trader, this is a challenging range full of chop due to indecisions in macro, geopolitical and locally in cryptocurrency markets. I don’t recommend day trading at this time if you are inexperienced. Professional traders will be challenged in this climate, so someone doing this part-time as a hobby with no formal trading or financial background is unlikely to thrive.
Promising Narratives: If you are looking to rotate into something new, these may offer respectable risk/reward, but do your own research:
- Memecoins seem to be experiencing a particularly spicy cycle, focus on big caps if holding long term
- Utility expansion on Bitcoin, like Ordinals, Stacks
- Ethereum L2s, especially projects built around BASE, which Coinbase will drive new traders to
- OG projects like DOGE or LTC that might see institutional interest following ETH ETF approval
- Emerging L1s like SEI that have VC investors & interest, VCs find ways to pump their bags eventually
- GameFi or NFTs related to gaming
- Web3 and crypto digital art. Cryptopunks, XCOPY, Beeple, and many others.
- Solana’s maturing DeFi ecosystem and maybe some top memecoins (nothing launched on pump.fun)
Long Term Trends
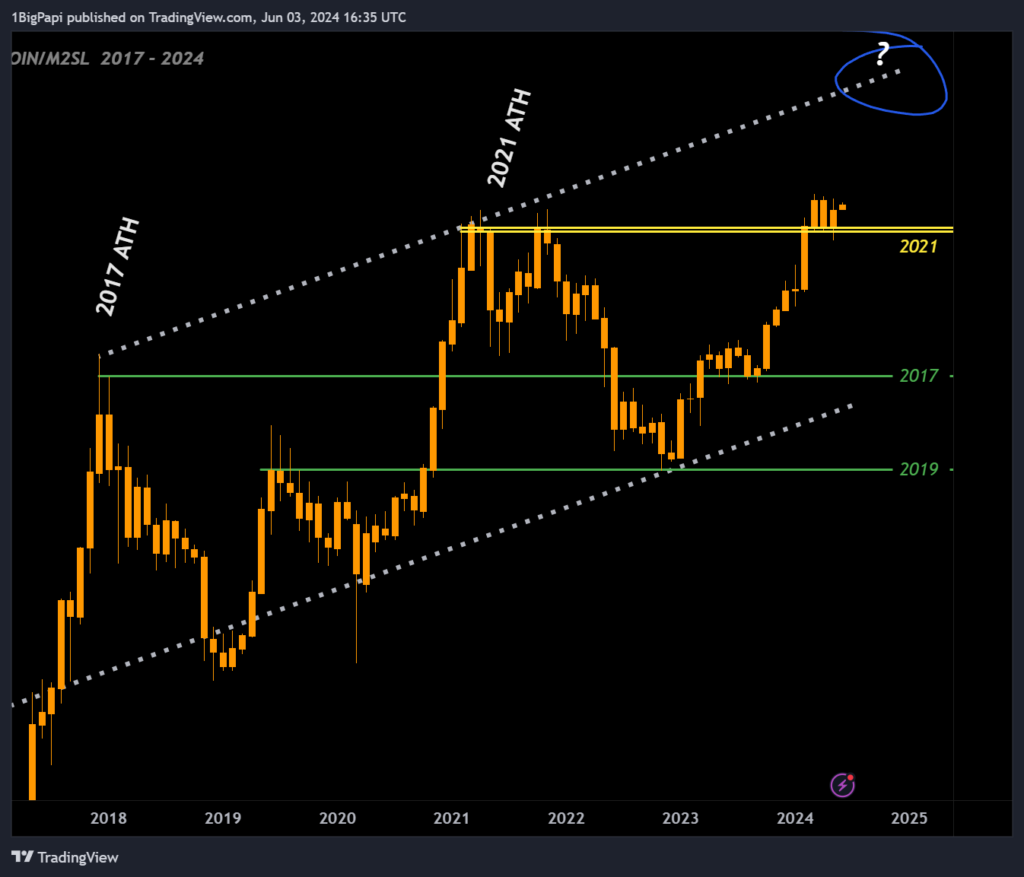
The market is rarely this simple, but one possibility is for the top to arrive along the same diagonal range we saw in 2017 and 2021, which would land around $140k if it lands between Q4 2024 and Q1 2025.
Below is the totality of Bitcoin’s logarithmic growth, another great way to display data that spans many orders of magnitude. This shows Bitcoin reaching the lower $100k range by early 2025. When considering the current cycle’s growth trajectory, that could arrive earlier, and go higher.

This cycle is different, due to institutional buyers and the economic climate. This makes it difficult to rely on historical trends, so we look for confluence across several data points when forecasting this cycle.
On-Chain Market Health –

Below is a list of popular data points that can INDICATE whether a cycle top is in range. Never take a singular piece of data as gospel, there is no single and guaranteed way to predict a cycle top.
Note: a glossary of each item is at the end of the article.
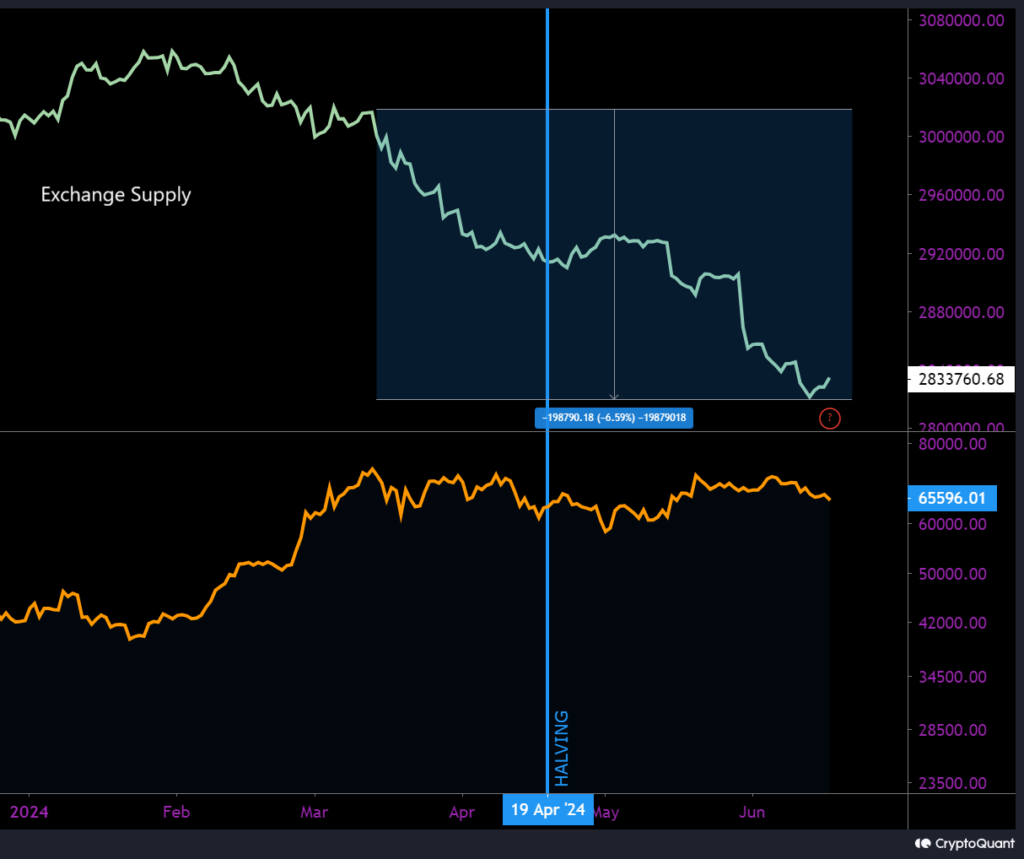
Supply of Bitcoin on Exchanges
- Performance 7d: Neutral (down very slightly past week)
- Performance YTD: Bullish
- Performance since we started consolidating in March: Bullish, nearly 7% total supply left exchanges
- Top Signal: No, supply continues to trend bullishly
Net Unrealized Profit and Loss (NUPL)
- Performance 7d: Neutral
- Performance YTD: Bullish
- Top Signal: No, but ~20% away from historical top signal
Market Cap to its Realized Cap (MVRV)
- Performance 7d: Neutral
- Performance YTD: Bullish
- Top Signal: No, but within 30% of historical top signal
Miner Position Index (MPI).
- Performance 7d: Neutral
- Performance YTD: Bullish, with Bitcoin supply among Miners at it’s lowest ever
- Top Signal: None at the moment
- Note: the last two times MPI was this low was prior to the 2017 and 2020 bull runs
Miner Reserve (Supply of Bitcoin)
- Miner supply of Bitcoin continues trending at it’s lowest level since 2010
- Miners low supply correlates to lower supply on exchanges since 2020, and increased demand. Eventually this will lead to a supply crunch.
Bitcoin Netflow (All Exchanges)
- Performance 7d: bullish, predominantly net outflows
- Performance YTD: Bullish
- Top Signal: No
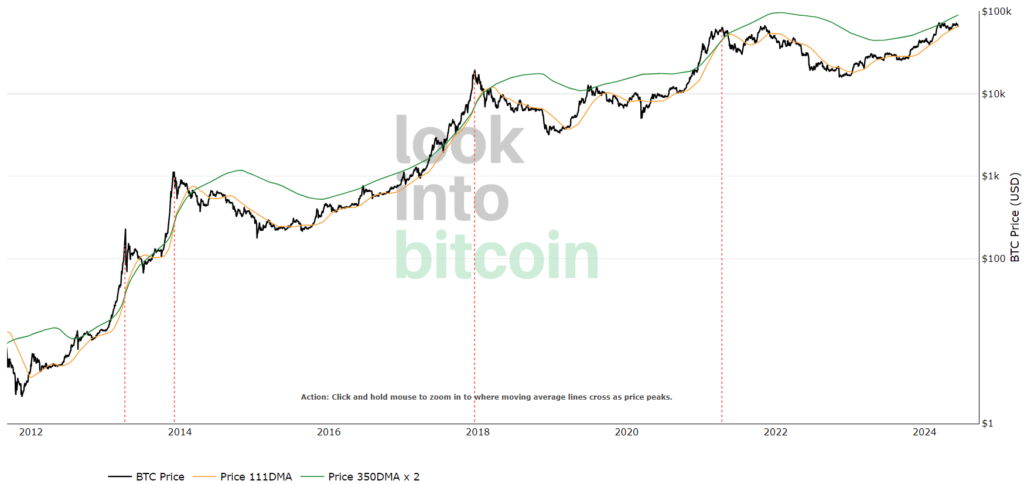
Pi Cycle Indicator
- Performance 7d: Neutral
- Performance YTD: Bullish
- Top Signal: No
The Pi Cycle’s moving averages are trending bullishly, moving towards each other but not at risk of crossing yet. The 111 DMA isn’t forecast to cross above the 350 DMA x2 before Q4 2024.
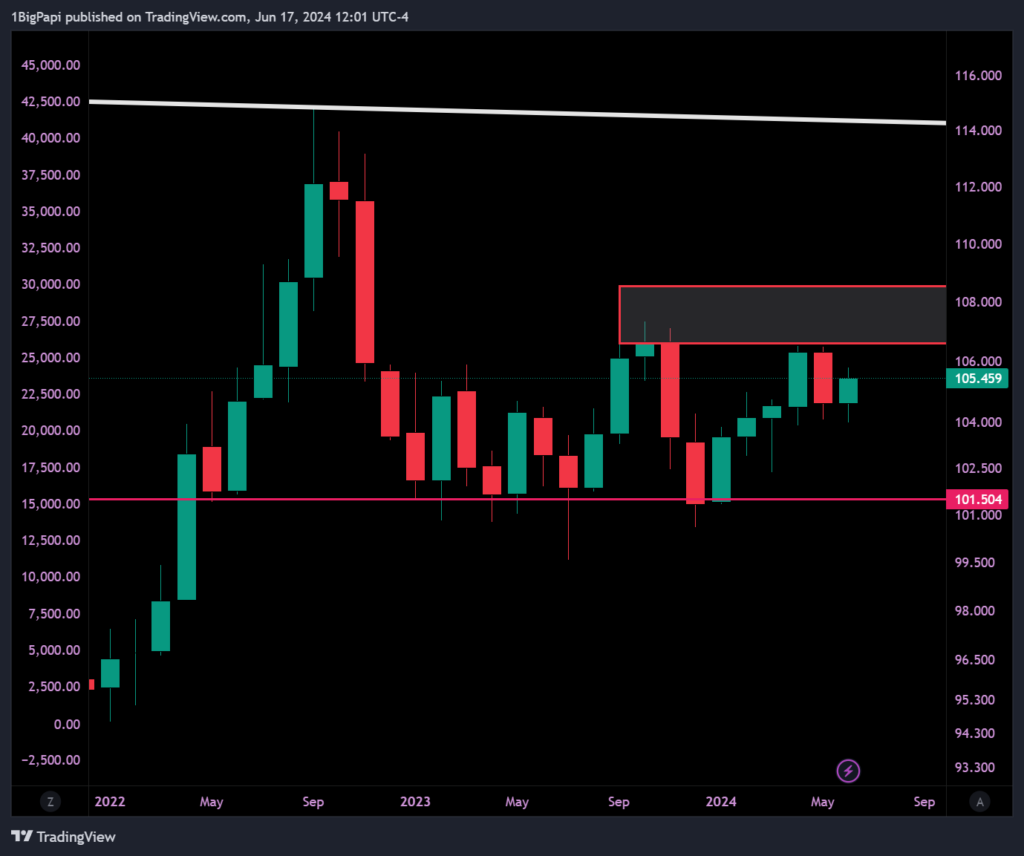
US Dollar Index (DXY).
- High timeframe bearish, my thesis isn’t changed there. Anything on lower timeframes is a distraction as the macro sorts itself out at the end of a rate cycle.
- We’ve long said we are waiting for the DXY to continue it’s downside move and this will be confirmed when a monthly closes under the key 101 level.
If inflation continues to retreat, that is inevitable, either later this year or early next year. Several months of rejections along 105 likely reflect anticipation of that downside move. And as we know, when the DXY falls, risk assets like crypto can rise.
Of course if inflation remains stubborn, it will lead to high rates for longer, but the Fed restated its very unlikely they would raise rates again. Higher for longer is largely priced in, if rate cuts appear later in 2024.
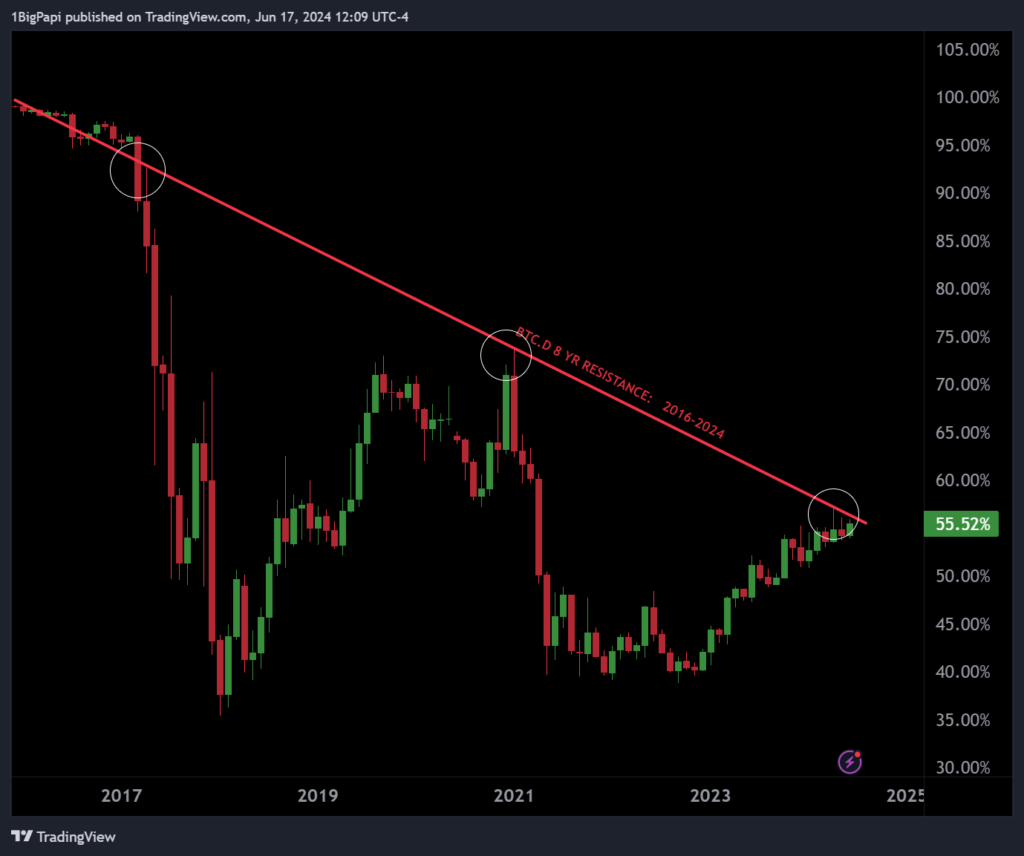
Bitcoin Dominance
No meaningful change here. We’ll see how it performs in the second half of the cycle, but currently Bitcoin is respecting an 8 year old trend, reflecting a growing share of the market cap by altcoins. Its possible for it to challenge that resistance, but under the current market conditions it seems unlikely.
Falling Bitcoin Dominance typically precedes altcoin cycles, where the altcoin market outperforms Bitcoin.
Total altcoin market is rising. Historic trends suggest it topping out at 2 to 2.5 tril, a 2.5x from here.
Its likely that most of the altcoin market continues to be Ethereum, which suggest a 2x to 2.5x from here, minimum, between $7,000 and $8,000 per ETH.
For the other popular altcoin, Solana, a 2x to 2.5x would land it between $350 and $450 per SOL.
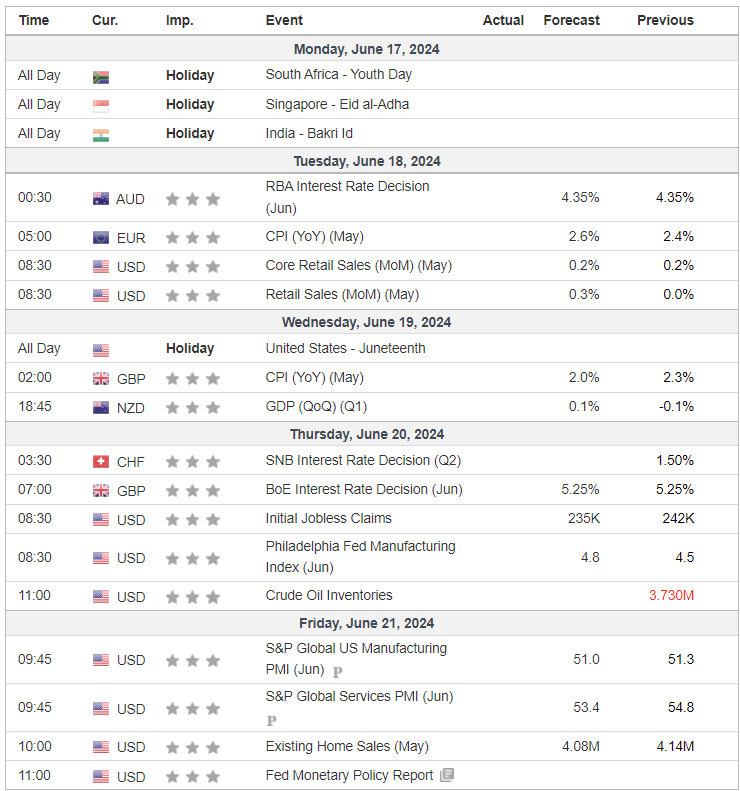
Crypto & Economic Calendar
The events below inform governments, corporations, traders and investors on the health of the economy. Events below are noted as “high volatility potential” in related markets.
Disclaimer: Nothing found on this website, or any sources linked to this website includes financial advice of any sort. We are not certified financial advisors, use our content at your discretion as entertainment, and as an educational resource. Do your own research.
If you enjoyed this article and want more hot takes and interesting posts about the economy, web3, crypto, decentralized finance, NFTS and more – follow Papi’s crypto analysis on Twitter/X at https://twitter.com/thectpapi or his NFT commentary on https://twitter.com/1mrpapi.
On-chain data sourced from Cryptoquant.com; you can sign up using my referral link: https://cryptoquant.com/sign-up?my-friend=gmpqkdsc
Glossary of Terms
Below is an explanation of each indicator and data point I discuss above.
Bitcoin Dominance:
Bitcoin dominance is another way of saying “Bitcoin market share,” or how much of the total crypto market is Bitcoin. While not the clearest indicator, on lower timeframes, you can use this information to speculate when altcoins may rally. This is also described as an “alt season.”
Altcoin rallies often follow a local or major top on Bitcoin dominance and can last for several weeks or longer, while Bitcoin consolidates for the next move. The recent memecoin cycle is a form of altcoin cycle.
Bitcoin Supply:
Supply trends are simple- rising supply on exchanges implies bearish pressure, because it’s there to be sold, and the opposite true when supply drops.
More Bitcoin is being bought and HODL’d than is being mined, and this has been the prevailing trend since 2020. As we know with commodities, scarcity boosts perceived value. With a 40% drain on total supply since 2020, we are trending towards scarcity faster than ever.
While general supply trends can signal sentiment, did you know you can also account for localization? For example, in the last cycle, as we approached the top, Asian and international exchanges logged notable increases in supply, while America was net decline. Effectively this meant Asians left many Americans holding bags near the top.
Net Unrealized Profit and Loss (NUPL):
NUPL indicates the total amount of profit/loss in all Bitcoins, represented as a ratio. You can see why that makes for a handy data point, because as more of the market is in-profit, the risk of a retracement rises.
NUPL indicates a potential minor or major top when it rises over 0.75. Another way to think of this is as a greed tracker. The higher the NUPL, the greedier the market is, and eventually greed will turn to fear, as profit-taking cascades towards the end of a cycle or subcycle.
Miner Position Index:
Miners are among the smartest traders in crypto. For obvious reasons they need to optimize their selling to fund operations. Miners sell to fund operations, but will HODL supply when conditions permit, and sell heavily in the early to middle bull market.
MPI is the ratio of miner selling against the yearly average. If its rising strongly above the average, it suggests miners are worried about a top approaching expedite their selling. They do not try to land the top of the market, so they often sell in advance, which is helpful to traders trying to also time their exits.
Bitcoin Netflow:
Another fun data point is netflow. This shows the net result of a day’s inflows (moving Bitcoin to an exchange) and outflows (moving Bitcoin off an exchange).
The implication is that Bitcoin moved off exchanges is unlikely to sell. And as we approach tops, the netflows skew towards increasingly heavier inflows (moving to exchanges to sell).
Pi Cycle:
The Pi Cycle indicator is something many traders joke about, but there is no doubting it’s effectiveness.
It uses the crossing of two key moving averages (MA) to predict cycle tops: 111 DMA and 350DMA x2. It accurately called earlier cycle tops within a few days. The top signal is when the 111 DMA crosses above the 350 DMA x2.
Whether you believe these two MAs can predict cycle tops, its worth keeping an eye on it. As you can see, we still have time before the MAs converge.
Market Cap to its Realized Cap (MVRV)
MVRV is used to understand when the exchange traded price is below “fair value” by looking at the ratio between market cap and realized cap (approximates the value paid for all coins in existence).
This gives an idea of whether the market is fairly priced and can be used to identify potential tops and bottoms in the market. As with any indicator, don’t use it in isolation; look for confluence with other data.
A new component this cycle is the orange line, the top of the MVRV range, which reflects an increasingly smaller ratio over time. For the first time this cycle, the longer term diagonal resistance is lower than the generally acccepted upper range of 3.7 for cycle tops, so traders should monitor both.
US Dollar Index (DXY):
The US Dollar Index (DXY) is an index that measures the strength of the US Dollar. There is an inverse relationship between the DXY and speculative markets like crypto and equities. In general, when the DXY is up, crypto is down. The opposite is also true.
Of particular importance, the ~101 level, arguably the most significant for the DXY. Almost every time in the past 50 years, when DXY rejected from, or closed under the 101 range, it led to a prolonged period of weakening dollar.
If the fed drops rates in 2024, thats a strong signal that the DXY will continue to drop, and rates will inevitably decrease, its just a question of timing and whether they will start in 2024 or 2025. For rate decreases to occur in a year along with the Bitcoin halving would be particularly bullish.
Market Sentiment:
Economic events, political discourse, or general price action are all events that can impact sentiment. The market remains predominantly bullish since October 2023.
Sometimes market sentiment needs to cool off, otherwise bull markets can burn out too early. The market moves in waves of fear and greed, and too much of either can lead to pronounced moves in the opposite direction, which can further cascade due to leverage in the market.
Going into the election cycle, we can expect some volatility to accompany the crypto narrative, with players like Senator Warren building an anti-crypto coalition. It remains to be seen if this will have a bigger impact on sentiment than the increasingly accomodating macro.