Hello, my name is Sam aka CountOnCrypto. As an introduction, here is a simplistic explanation of how I plot and utilise daily/ weekly and monthly support and resistance levels; any easy step-by-step guide.
Step 1: Identifying daily levels.
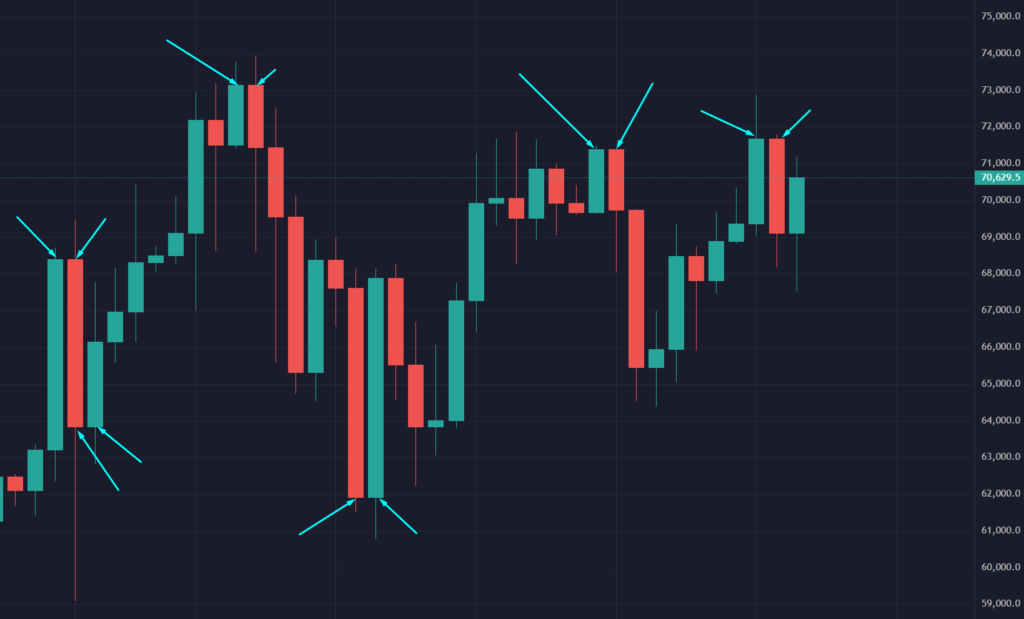
When two candle bodies close together at the same price, this is how we identify our D/W/M support and resistance levels. Below are some, but not all examples found on the daily chart.
Step 2: Validating daily levels.
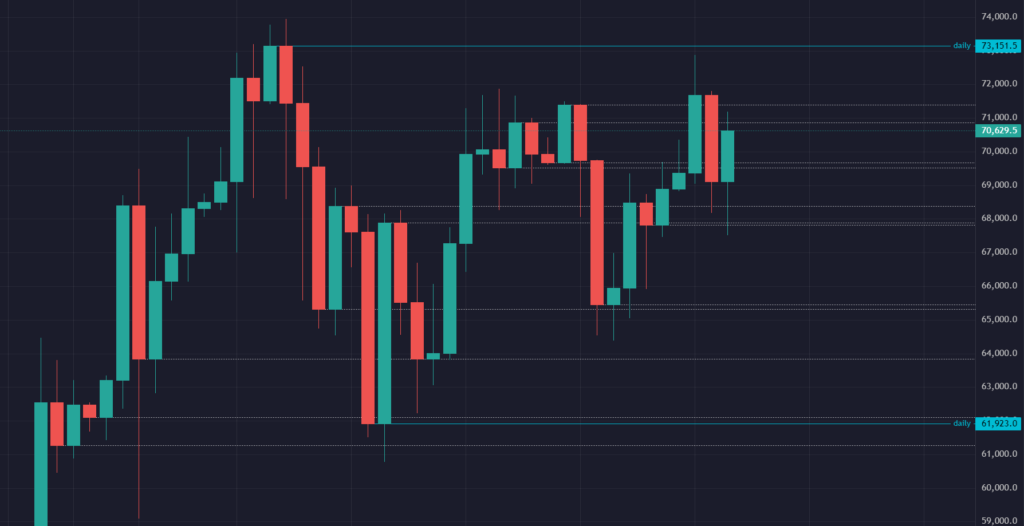
So you may be wondering, how can I tell which levels are valid just by looking? Well, that’s easy! Our valid daily levels have not come into contact with other candle bodies/ wicks after they were confirmed. These are marked in light blue. The white dotted lines were previously valid daily levels, but now they are all hit we should remove them.
Step 3: Utilising daily levels to make trades.
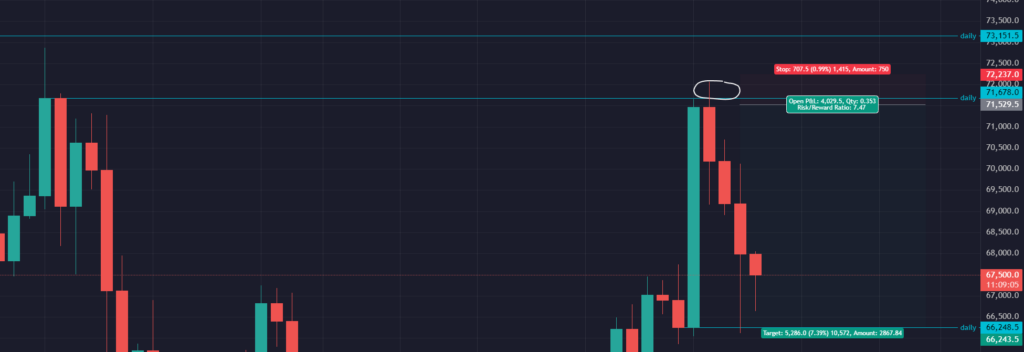
Now you know how to plot daily levels and validate them, you may be wondering how to utilise them to make trades. Below is an example of a swing short trade between two daily levels. By utilising the simplicity of daily levels, traders could base an entry and exit off two daily levels and yield a profit of almost 7.5% with a risk-to-reward ratio of 1:7.5.
Conclusion: Now you’ve learned how to plot, validate and make trades using daily levels. Let’s have a look at weekly and monthly levels.
Step 1: Identifying and plotting valid weekly levels.
Here are the latest 3 weekly S/R levels plotted for you, these are high time frame levels which require two weeks to form. That’s two weeks of price action which failed to close above/ below the previous candle body showing strength/ weakness.
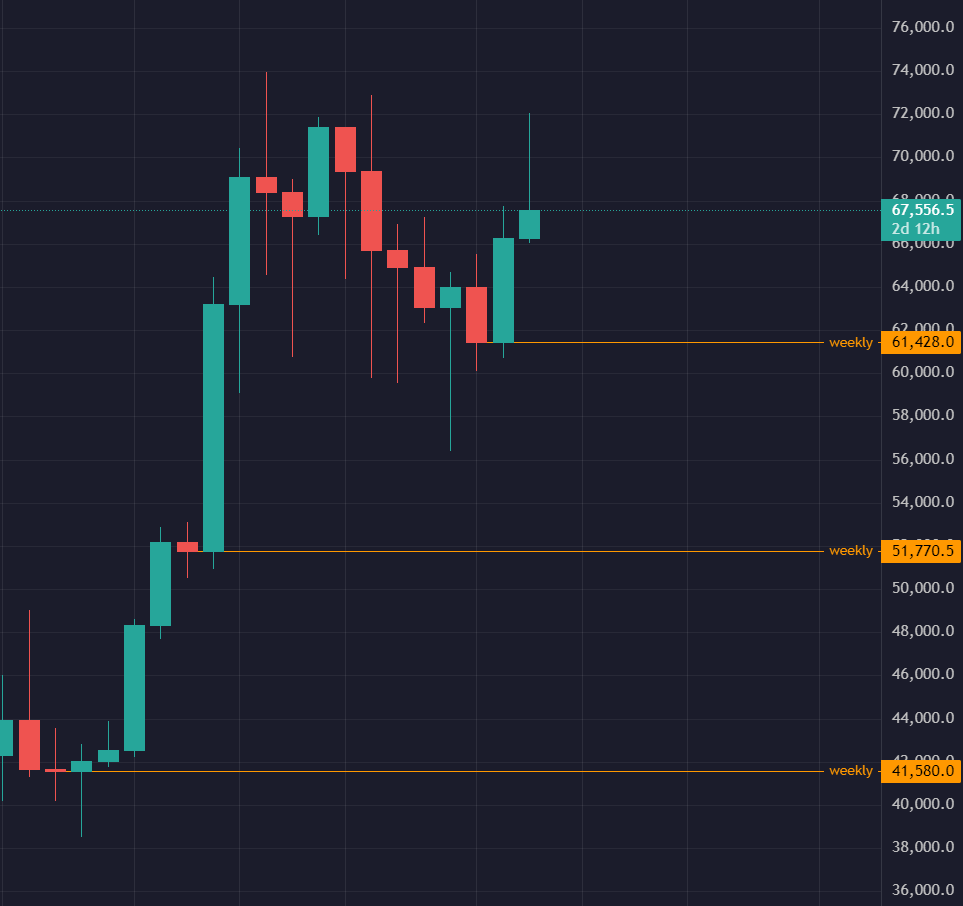
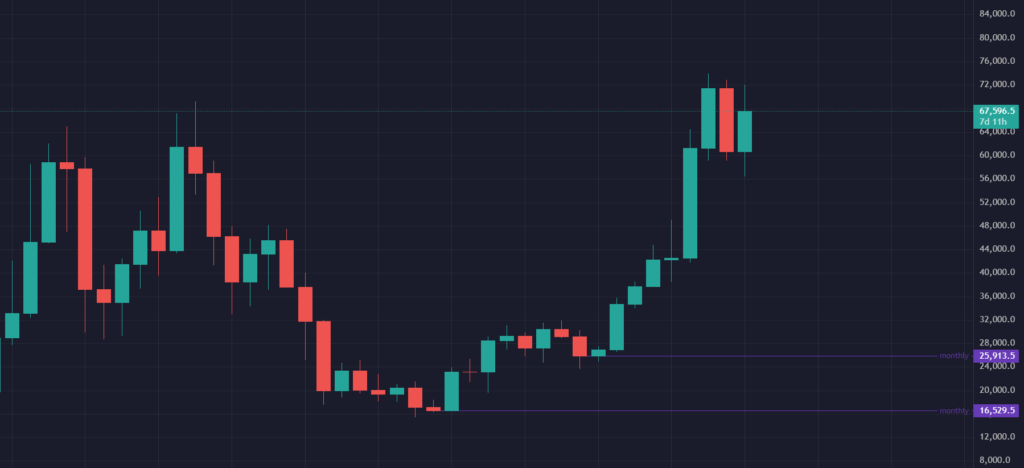
Step 2: Identifying and plotting monthly levels.
Here are the two valid monthly support levels, left behind; where the Bitcoin price formed strong support over a period of two months and moved up leading to a bull run.
Trade Example
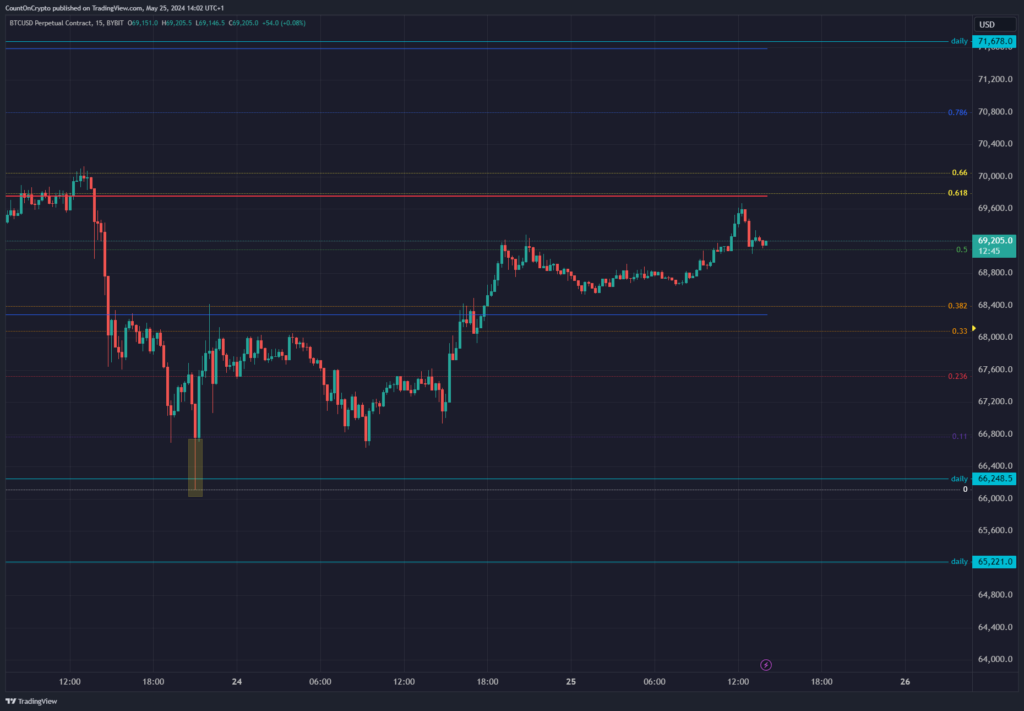
Below is an example of a trade I made using daily levels as pivots, first let’s have a look at where the daily level was plotted according to the rules.
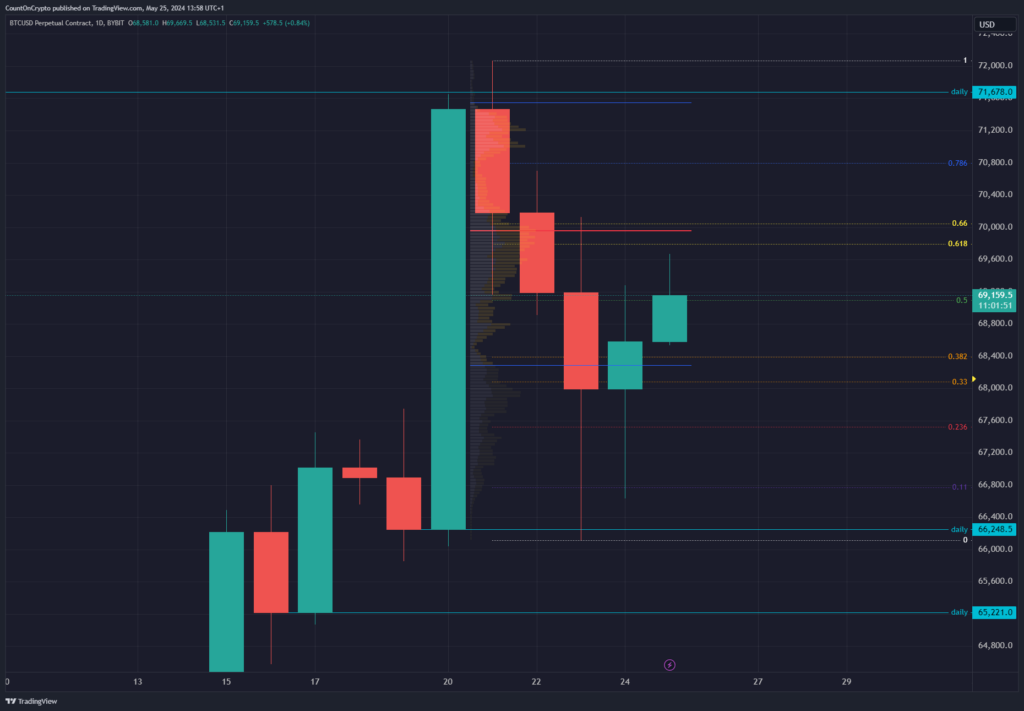
Reaction
There was a strong reaction/ bounce when the Bitcoin price hit the daily level. This was my entry trigger, a strong visual reaction suggests larger traders have stepped in to buy and pushed the price back up.